P Value Calculator
Enter the values and calculate the P-value from the statistical test you performed.
P Value Calculator:
This P value calculator finds the one-tailed or two-tailed p-values from the given statistical score, such as Z-score, T-score, F-ratio score, Pearson (R) score, chi-square value, and Tukey Q score. It also compares your result with the chosen significance level and tells you whether your findings are statistically significant or not.
Our calculator is very useful for students, researchers, and data analysts who perform hypothesis testing and need instant, accurate results. No matter whether you need to check the significance of a test, measure the correlation, or analyze the sample data, this calculator simplifies the process and helps to understand the results.
How To Use P Value Calculator?
Step 1: Choose Your Test Type
Select whether you are using a Z-test, T-test, Chi-Square test, Pearson R, F-test, or Tukey Q Score.
Step 2: Enter Your Test Statistic
Enter the value you obtained from your statistical test
Step 3: Select the Tail Type
Choose one-tailed or two-tailed, depending on your hypothesis test
Step 4: Input Degrees of Freedom (if required):
For “T” or “Chi-Square tests”, provide the degrees of freedom (df).
Step 5: Click “Calculate”:
The calculator will instantly display the P-value and show whether your result is statistically significant based on the chosen significance level (e.g., 0.05).
What Is a P-Value?
The p-value is the probability of observing a result as extreme as or more extreme than the obtained value while considering the null hypothesis (H₀) true. This helps to understand whether the result occurred by random chance or indicates a real effect.
Null Hypothesis (H₀):
When there is no difference between the observed value and the expected value, then this condition is known as the null hypothesis.
Alternative Hypothesis (H₁):
This condition shows a difference between the expected and the observed value. Meanwhile, it proposed that there is an effect on the data.
Significance Level (α):
It's the significance level (commonly 0.05) used to determine whether to reject the null hypothesis or not. If the value (α) is less than, the result is statistically significant. It means your results are so unlikely to happen randomly.
How To Calculate P Value?
There are various statistical tests (Z score, T score, Chi-square, etc.), and each test employs unique parameters to calculate the p-value. A p-value is based on the probability distribution of the test under the null hypothesis (H₀).
P value from Z Score:
A z-score tells you how far a specific point is from the average(mean) value, assuming a normal distribution. It is used for large samples (n > 30) or when the population standard deviation (σ) is known.
\( Z = \frac{X - \mu}{\sigma} \)
Steps to find P-value from Z-score:
- Calculate the z-statistic for deriving the P-value with the given formula
- After getting the calculated test statistic, use the z-score table to determine the P-value
- For a two-tailed test, double the one-tailed P-value
P Value From T Score:
A t score, like a z score, is a standardized score used in statistics to determine the distance of a point from the mean value. It is used when the sample size is small (n < 30) or when the population standard deviation (σ) is unknown. Read on to know how to find the p-value from the t-score!
\( t = \frac{(X - \mu)\sqrt{n}}{S} \)
Steps to find P-value from t-score:
- Calculate the t-statistic
- Find the corresponding p-value using the t-distribution table or calculator, based on degrees of freedom (df = n - 1)
Result Interpretation:
- Positive T-score: The data point's value is above the mean value. It means the higher the p-score, the farther above the data point is
- Negative T-score: It means that the data point is below the population mean value
- T-score of 0: It means that the data point is equal to the population mean
P value from Chi-Square:
A chi-square test is used to determine the relationship between the categorical variables. With the help of the chi-square test, you can determine whether there’s a statistically significant difference or not between what you expected and what you observed in your data, especially when analyzing surveys with categorized answers. It helps you understand how likely the results are due to chance.
If the value of the difference X2 is large, then it means there is a large difference between the expected and observed values. It suggests a relationship between the variables. It does not provide any information about the direction(positive or negative). You can calculate the P-value from the chi-square statistic. For quick and accurate results, use our Chi Square P Value Calculator.
\( \chi^2 = \sum \frac{(O - E)^2}{E} \)
P Value From F Statistic:
The F-statistic is used to assess the difference between the variances of two or more groups (populations or samples). The interpretation of the F text depends upon the resulting p-value. Therefore, stay attentive and focused whether you are performing the manual calculation or doing it with the help of the P-value calculator.
\( F = \frac{s_1^{2}}{s_2^{2}} \)
Where:
- (s1)2 indicates the first sample variance
- (s2)2 represents the second sample variance
Result Interpretation:
- Low p-value: Variances are significantly different (reject H₀).
- High p-value: No significant difference (fail to reject H₀).
P-Value From Pearson (r) Score:
Pearson (r) score is a statistical measure that finds the degree of linear relationship between two quantitative variables. It gives the value between -1 and +1, indicating the relationship and direction. You can use the number between -1 and +1 and the degree of freedom (N-2) to find the P value from the r score.
Steps to Find the P-value:
Finding the P-value from the Pearson (r) score involves the following steps:
Step #1: Calculate the test statistic (t)
\( t = \frac{r\sqrt{\,n - 2\,}}{\sqrt{\,1 - r^{2}\,}} \)
Step #2: Determine the degrees of freedom (df) = n−2
Step #3: Use the t-distribution table to determine the critical t-value and interpolate (if necessary)
\( y = y_1 + \frac{(x - x_1)(y_2 - y_1)}{x_2 - x_1} \)
Step #4: Approximate P value
Use a P-value table/chart to approximate the P-value, or get the exact P-value effortlessly by using our P value calculator.
Result Interpretation:
- Strong Positive Correlation (r ≈ +1): If it gives a value that’s near +1, then it means that increasing one value increases, the other value will also increase
- Strong Negative Correlation (r ≈ -1): When the value is closer to -1, then it means that on increasing one value, the other value will decrease
- Weak or No Linear Correlation (r ≈ 0): If the value is near 0, then it indicates a weak or no relation between the variables
P-Value From Tukey Q Score:
Tukey's HSD (Honestly Significant Difference) is the test that compares groups in the data and finds significant differences to determine whether they are significant or not.
To find the p-value from the Tukey Q Score:
- Determine the Tukey Q Score: It shows the magnitude of the difference between two groups
- Calculate the Degrees of Freedom(df): It relies upon the number of groups that are compared and the sample size
- Studentized Range Distribution Table: Use the table that contains the calculated q-score and degrees of freedom
- Approximate the interpolation: If the q score does not match with any value of the table, then use the interpolation to find the p value
We mentioned how easily you can calculate p-values from various statistics. For more convenient calculations, you can start using our P value calculator. It uses different scores and an appropriate distribution to provide you P-value directly.
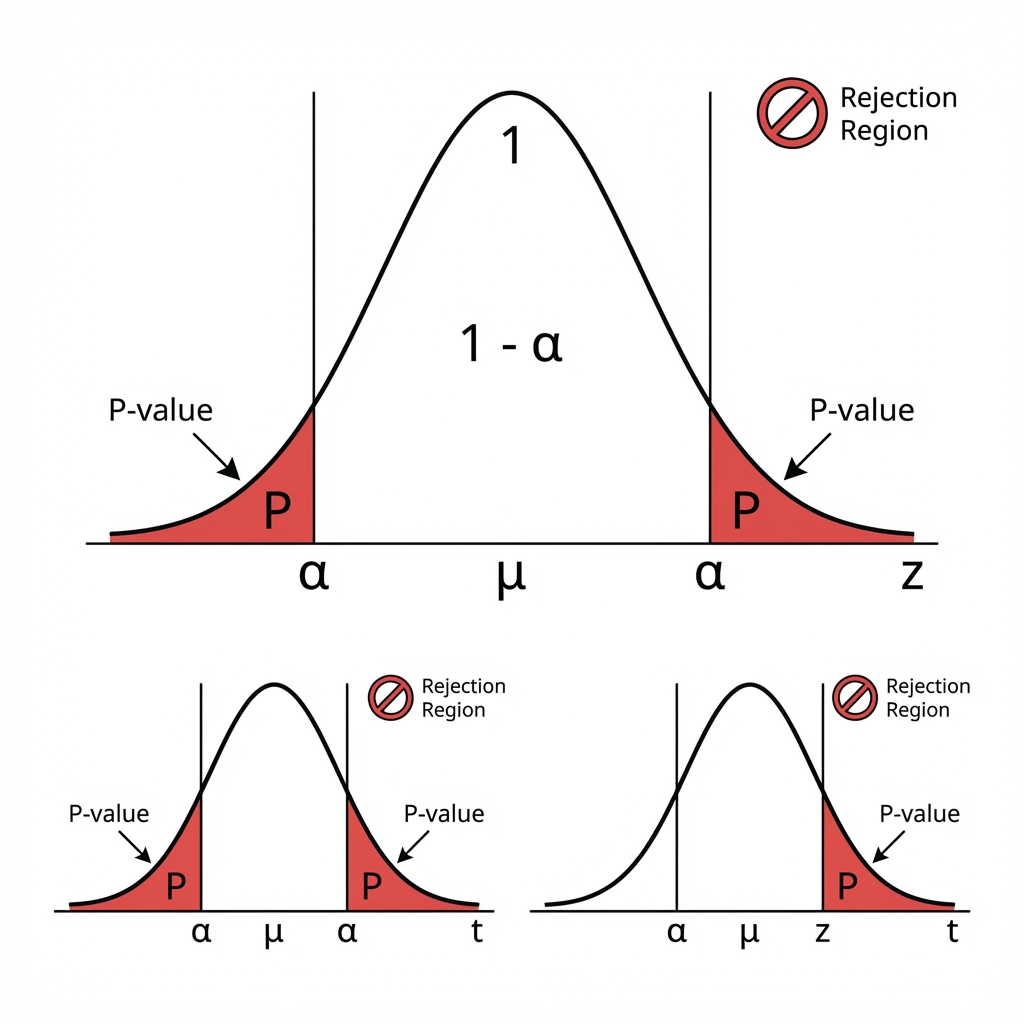
One-Tailed vs Two-Tailed Tests:
- One-tailed test: Tests for an effect in one direction to determine whether the sample mean is greater or smaller than the population mean value (e.g., mean > μ or mean < μ)
- Two-tailed test: Tests for an effect in both directions to find out whether the sample mean is different from the population mean value (e.g., mean ≠ μ)
- Two-tailed p-value = 2 × (one-tailed p-value)
How To Interpret P-Value Results?
- When the P-value is ≤ significance level(α), then it means that the result is statistically significant. It indicates that there is evidence to reject the null hypothesis (H₀)
- When the P-value is > the significance level(α), then it indicates that the result is not significant, and the p-value does not provide evidence to reject the null hypothesis (H₀)
Limitations & Considerations of P Value:
Keep in mind that the p-values are good but not perfect. When dealing with them, remember the following points:
- P Hacking: When you are trying different tests in an attempt to get p <0.05, then you may have wrong results. Remember to plan your analyses before performing the testing
- Multiple Comparisons: At the same time, performing more than one test can lead towards having a random significance. If you are doing that, then use the Bonferroni or FDR corrections
- Effect Size: if the result provides a small p-value then it means the effect is small and less important. Therefore, it is necessary to determine how strong the effect is
- Other Helpful Measures:
- The confidence interval indicates the range of the true result
- To know how much data supports one type of hypothesis over another, use the Bayes factors
Note: P-value is should not be the sole basis for a conclusion about the result. It works best when interpreted together with effect size, confidence intervals, and other context-specific knowledge.
Example P-Value Calculations for Common Statistical Tests:
| Example | Test Type | Given Statistic | >Degrees of Freedom (df) | Approx. P-Value (Two-Tailed) | Interpretation |
|---|---|---|---|---|---|
| 1 | Z-test | z = 2.10 | — | 0.0358 | It means there is a 3.6% chance of observing this result by random chance. |
| 2 | t-test | t = 2.10 | 20 | 0.048 | The result is significant at α = 0.05 (evidence to reject H₀). |
| 3 | χ²-test | χ² = 6.63 | 1 | 0.010 | It means there is a great difference between the expected and observed values. |
| 4 | F-test | F = 3.25 | (2, 18) | 0.061 | Slightly above 0.05, which means the result is not statistically significant. |
Why Use Our P value Calculator?
Our p vlaue calculator is designed to make hypothesis testing easy, simple, and fast.
Main Features
- Instant Results: Choose the type of the test, enter your statistical values, and get the p-value in seconds. Our calculator provides accurate and lightning-fast results.
- One-Tailed & Two-Tailed Tests: You can easily choose the direction of the hypothesis for accurate calculations of the result.
- Simple Inputs: Our tool contains a simple and easy-to-use interface. To use it, don’t need to be an expert. Simply, provide basic test details, and the calculator does the rest
- Broad Compatibility: Our calculator is easily accessible across various platforms, including:
- Mobile Devices
- All Browsers, etc
FAQ’s:
Does p = 0.03 mean 3% chance that H₀ is true?
No, having a p-value like 0.03 does not mean there is a 3% chance that H₀ is true. Instead, it means if the null hypothesis were true, there is 3% chance that you would get the result as extreme as your observed one. The probability is small, so you may reject the null hypothesis H₀ at 0.05 significance.
Can P-Value Be Negative?
No, a p-value is the measure of probability and can never be negative. All the probabilities range between 0 to 1, inclusive of 0 ≤ P-value ≤ 1.
What is “Statistical Significance”?
Statistical significance is used in hypothesis testing to find whether the observed result is due to a real effect or not, or occurred by random chance or sample error. In simple words, when a result is statistically significant, then it means he evidence is strong enough to suggest that the effect is likely real, not just by chance.
References:
- From the source of Wikipedia.org: P-value.
- From the source of statisticshowto.com: What is statistical significance?
- From the source of ncbi.nlm.nih.gov: Statistical Significance.
Related Tools