Standard Deviation Calculator
Enter the data set values to calculate the standard deviation (σ).
Standard Deviation Calculator
This standard deviation calculator quickly finds how spread out the numbers are in a dataset. It shows you whether the data values are clustered closely around the mean or widely scattered. The tool also provides the mean, variance, coefficient of variation, standard error of mean, and step-by-step calculations. This makes it an ideal tool for students, teachers, and professionals who require fast and reliable results.
What Is Standard Deviation?
Definition:
Standard Deviation (σ) measures how much individual data points vary from the mean. Standard deviation measures how spread out your data is.
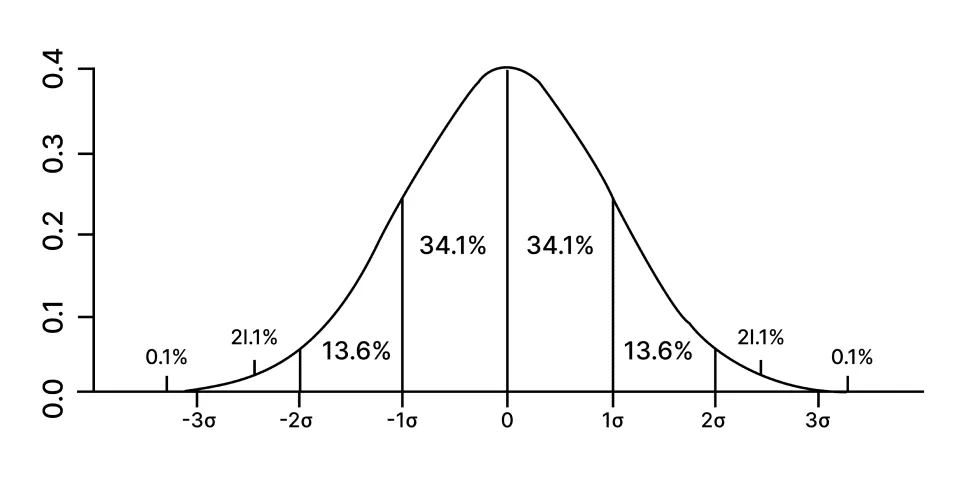
What it Tells Us About Data Spread?
A low standard deviation means the values are close to the mean, while a high standard deviation indicates that the values are more spread out. This concept is widely used across different fields:
- Finance: To measure portfolio volatility and investment risk
- Climate Studies: To track variability in temperature or rainfall
- Sports and Games: In evaluating performance consistency
- Probability and Statistics: To understand how much outcomes deviate from the expected value
Population vs. Sample Standard Deviation:
- Population Standard Deviation:
- Uses the entire dataset
- Divide the sum of squares by the total number of data points (n)
- Sample Standard Deviation:
- Used when working with a sample of the population
- The formula divides by (n-1) instead of “n” to correct for bias
- This adjustment provides an unbiased estimate of the population's true standard deviation. It is referred to as the corrected sample standard deviation
Now, check out the table below to clearly see the differences between the sample and population standard deviation:
| Criterion | Sample Standard Deviation (s) | Population Standard Deviation (σ) |
|---|---|---|
| Formula | \(s = \sqrt{\dfrac{1}{n – 1} \displaystyle\sum_{i=1}^n\left(x_{i} – \bar{x}\right)^2}\) | \(σ = \sqrt{\dfrac{1}{N} \displaystyle\sum_{i=1}^N\left(x_{i} – μ\right)^2}\) |
| Use Case | Used when only a subset of the total population is sampled | Used when the entire population data is available |
| Example | Analyzing test scores of 30 students in a class | Analyzing test scores of all students in a school |
| Application | Useful in studies, surveys, and research | Useful in complete data analysis, such as census data |
| Bias Adjustment | Divides by \(n - 1\) to correct bias | Divides by \(N\), assuming all data points are known and included |
| Calculation | Typically used when sampling data | Used for calculating exact statistics from a full population |
Standard Deviation Formulas:
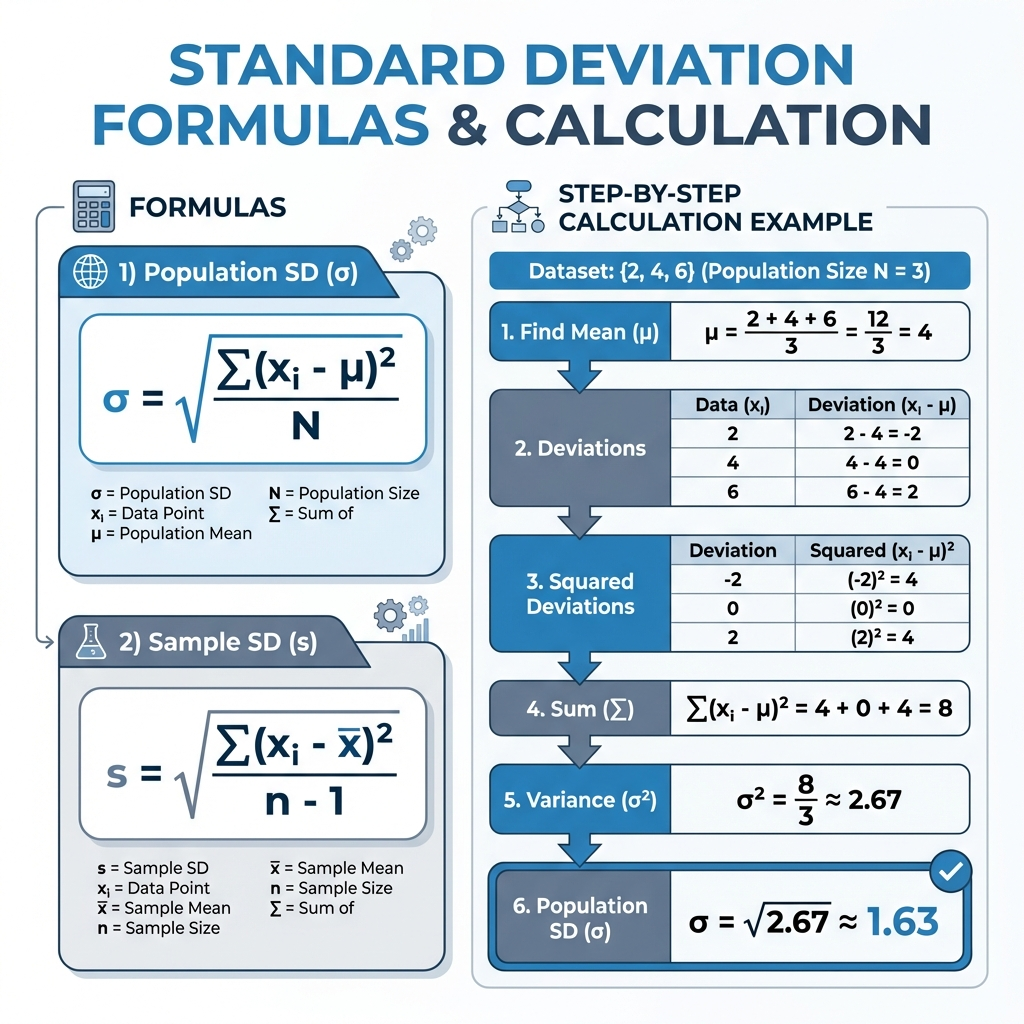
1. Population Standard Deviation:
When all the members of the population can be sampled, then the following standard deviation formula is used:
\(\sigma = \sqrt{\dfrac{1}{N} \displaystyle\sum_{i=1}^N (x_i - \mu)^2}\)
Where
- σ = Population standard deviation
- \( x_{i}\) = Individual value
- μ = Average mean value/expected value
- N = Total number of values
2. Sample Standard Deviation:
The given formula is used for finding the standard deviation of a sample (subset of data drawn from the population):
\(s = \sqrt{\dfrac{1}{n - 1} \displaystyle\sum_{i=1}^n (x_i - \bar{x})^2}\)
Where
- s = Sample standard deviation
- \( x_{i}\) = Each single value in the data set
- x = Sample mean
- n = Total sample size
How To Calculate Standard Deviation Step By Step?
Follow these steps to learn how to find the standard deviation manually:
- Calculate the Mean:
Find the average of the data set by adding all values and dividing by the total number of values. - Find the Distance from the Mean:
Subtract the mean from each value in the data set. - Square Each Distance:
Square the result of each distance calculated in step 2. - Sum the Squared Values:
Add up all the squared distances. - Calculate Variance:
- For population variance: Divide the sum by the total number of values (N)
- For sample variance: Divide the sum by one less than the total number of values (n - 1)
- Find the Standard Deviation:
Take the square root of the variance. The result is the standard deviation.
Example:
Suppose you have a data set (3, 4, 9, 7, 2, 5 ), find its standard deviation.
Solution:
Step #1(Calculate Mean Value):
\(\bar{x} = {\dfrac{3 + 4 + 9 + 7 + 2 + 5}{6}}\)
\(\bar{x} = \dfrac{30}{6}\) \(\bar{x} = 5\)
Step #2(Calculate The Value Of \(\left(x_{i} – \bar{x}\right)\):
| Data Values (xi) | xi - x̅ | (xi - x̅ )2 |
| 3 | 3 - 5 = -2 | (-2)2 = 4 |
| 4 | 4 - 5 = -1 | (-1)2 = 1 |
| 9 | 9 - 5 = 4 | (4)2 = 16 |
| 7 | 7 - 5 = 2 | (2)2 = 4 |
| 2 | 2 - 5= -3 | (-3)2 = 9 |
| 5 | 5 - 5 = 0 | (0)2 = 0 |
Step #3 (Sum of Squared Deviations):
4+1+16+4+9+0 = 34
Step #4 (Variance):
For sample (n = 6):
\(\ s^2=\dfrac{34}{6 - 1} = 6.8\)
For population (N = 6):
\(\ σ^2= \dfrac{34}{6} = 5.67\)
Step #5 (Standard Deviation):
Sample:
\(\ s = \sqrt{6.8} \approx 2.61\)
Population:
\(\ σ = \sqrt{5.67} \approx 2.38\)
How to Use Our Standard Deviation Calculator?
Follow the steps below to calculate the Standard Deviation using our SD calculator:
- Input format: Enter numbers separated by commas, or spaces.. You can use decimals and negative values. Example inputs:
- 12, 23, 45, 33, 65, 54, 54
- 12, 23, 45, 33, 6.5, 5.4, 54
- 12, 23, 45, 33, 6.5, -5.4, -54
- Choose Options: Select sample (uses n - 1) or Population (uses N) before calculating
- Tip: Choose the sample standard deviation calculator option to compute results if your data is a subset of a larger population
- Click "Calculate" to view the results
- Outputs shown: Standard deviation (σ or s), variance, mean, coefficient of variation, standard error of the mean, and a step-by-step calculation breakdown
- Export/copy results: Use the Copy or Download buttons to save your outputs
Applications of Standard Deviation:
Statistics And Research:
- Helps to measure the variability in surveys and experimental data
- Allows for checking the variability and detecting outliers in the data sets
- Useful in hypothesis testing and probability measurement
Business And Finance:
- Helps in determining the investment risks
- Allows for assessing the performance of stocks, the value of different assets, and funds
- Analysts use a population standard deviation calculator when working with the complete market data
- Supports creating the right financial model for a business
Data Analysis:
- Allows for determining how much the data is spread around the mean
- Helps to find the unusual patterns in the datasets(fraud, unexpected changes in the sales data)
- Allows for a good prediction of data models
Quality Control And Engineering:
- Helps to maintain the reliability of the engineering designs
- Allows for monitoring the product consistency in the manufacturing line
- Helps to identify the changes happening against the defined standards
Related Concepts And Comparisons:
Variance vs. Standard Deviation:
Variance measures the squared deviations from the mean, while standard deviation is the square root of variance. The variance is measured in square units. On the other hand, the standard deviation gives the result in the original units so that it can be easily interpreted.
Standard Deviation vs. Standard Error:
The standard deviation shows the spread of data points around a mean, while the standard error defines how far the mean is from the actual population mean. It helps to build the confidence interval, which shows the range where the original mean lies.
Coefficient of Variation (CV):
It is the ratio of the standard deviation to the mean, shown as a percentage. With it, you can easily compare the variability between datasets having different units or scales.
FAQ’s:
Why Calculate Standard Deviation?
Calculating standard deviation helps in understanding the variability in the different datasets, assessing the reliability of data, or consistency within a dataset.
Can Standard Deviation Ever Be Negative?
No, the standard deviation is derived from the square root of the variance, and since the variance is always a non-negative number, the standard deviation can never be a negative number. The smallest value is zero, which only occurs when all the dataset values are the same.
What is The Formula For Standard Deviation in Excel?
For a sample, use =STDEV.S(range)
For an entire population, use =STDEV.P(range)
What If My Dataset has Outliers?
They are the data points that are different from your observation. The way to handle them depends on their cause and effect.
If your data has an outlier, then perform the following steps:
- Identify their nature, whether they are errors or real events, or the actual valid values
- Decide on the action that you need to perform on them. Remove them if they are errors, but if they are meaningful, then apply more advanced statistical methods to reduce their impact
How Do I Interpret a High vs Low Standard Deviation?
- Low Standard Deviation: The data points are clustered closely around the mean, showing consistency and low variability
- High Standard Deviation: The data points are spread out from the mean, showing greater variability and inconsistency
Key Takeaways:
- What it is: The standard deviations help to understand how much the data points differ from the mean value
- Why it matters: It shows the spread of the data and helps you understand variability so that you can make better comparisons
- How this standard deviation calculator helps: It instantly computes standard deviation, variance, mean, and more, saving time and reducing errors
Related Tools