Z Score Calculator
Select the method of your choice and input the necessary variables. The calculator will determine the Z-score for raw data, displaying proper calculations
An online z score calculator helps to find a z-score from the given raw value. Also, this z value calculator helps to find the z-value by using:
- A raw data point
- Sample mean and size
- A data sample
- With ‘P’ value
Well, give a thorough read t this informative content to know how to calculate z score, its standard formula, statistics z score table, and much more. Also, you can try our online critical value calculator that helps you to calculate the critical value for the different distributions. Read on!
What is Z score (Statistics)?
The z-score is also known as the standard score, normal score, or z value used to describe the normal distribution of the raw data. In statistics, the z-score significantly indicates that how much a given value differs from the standard deviation (SD). Z score may be positive or negative. The score above the average mean is represented by the positive Z score value while the score below the average mean is represented by the negative Z score value. If the Z score value is zero, then it will be equal to the average mean. For example: if the z value is +2, it means that two standard deviations are above the mean.
What is the Z-Score Formula?
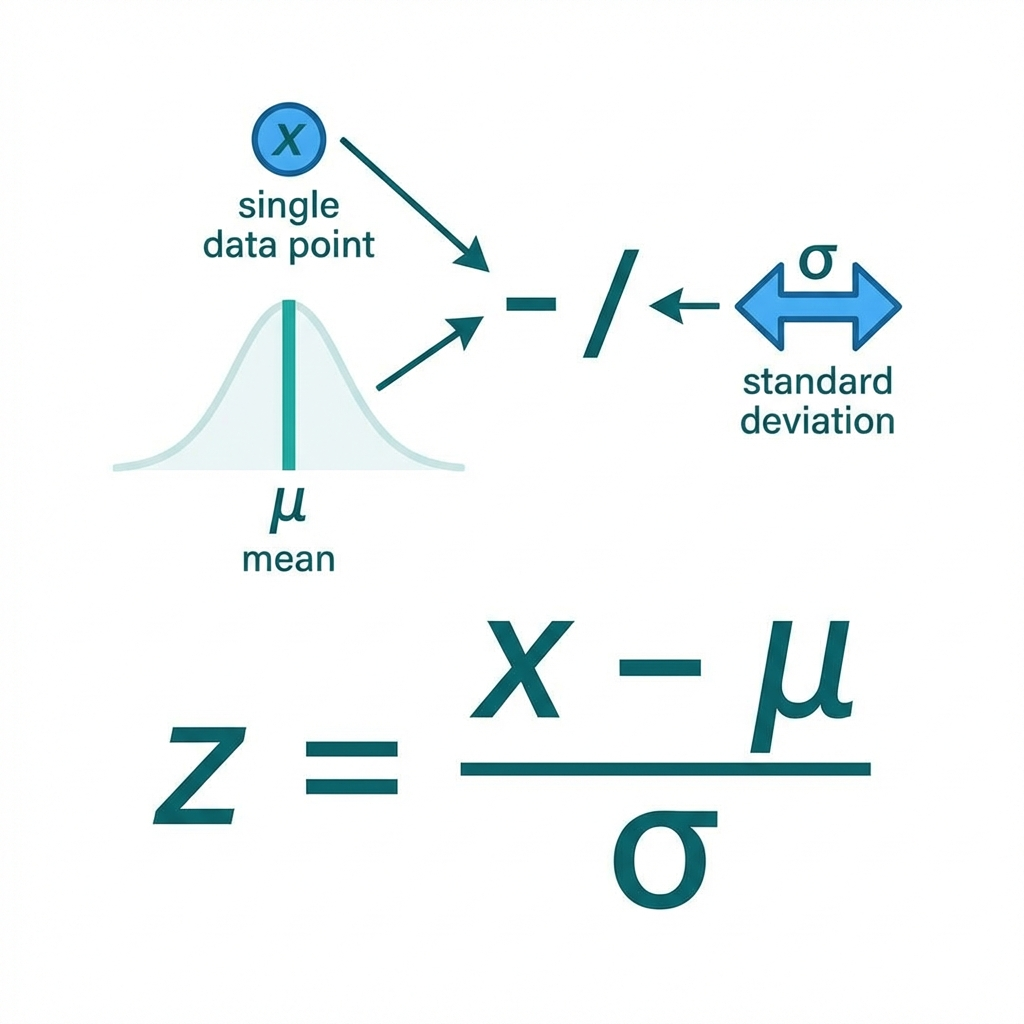
The Z-score measures how many standard deviations a data point is from the mean. It is calculated as the difference between the raw data and the population mean, divided by the standard deviation:
\[ z = \frac{x - \mu}{\sigma} \]
Where:
- \(x\) = raw data point
- \(\mu\) = population mean
- \(\sigma\) = population standard deviation
When the population mean is known and you are using a sample mean:
\[ z = \frac{\bar{X} - \mu}{\sigma / \sqrt{n}} \]
Where:
- \(\bar{X}\) = sample mean
- \(n\) = sample size
- \(\sigma / \sqrt{n}\) = standard error of the mean
Z-Score Table:
The z-score table is used to determine the percentage of the population that lies above or below any z-value. Simply, calculate the z stat value from this z score calculator and find where the z-stat value lies.
Z Score Table (Right):
The z-table is the normal distribution shows the area to the right-hand side of the curve. You can use these values to determine the area between z=0 and any positive (+) value.
| z | 0.00 | 0.01 | 0.02 | 0.03 | 0.04 | 0.05 | 0.06 | 0.07 | 0.08 | 0.09 |
|---|---|---|---|---|---|---|---|---|---|---|
| 0.0 | 0.0000 | 0.0040 | 0.0080 | 0.0120 | 0.0160 | 0.0199 | 0.0239 | 0.0279 | 0.0319 | 0.0359 |
| 0.1 | 0.0398 | 0.0438 | 0.0478 | 0.0517 | 0.0557 | 0.0596 | 0.0636 | 0.0675 | 0.0714 | 0.0753 |
| 0.2 | 0.0793 | 0.0832 | 0.0871 | 0.0910 | 0.0948 | 0.0987 | 0.1026 | 0.1064 | 0.1103 | 0.1141 |
| 0.3 | 0.1179 | 0.1217 | 0.1255 | 0.1293 | 0.1331 | 0.1368 | 0.1406 | 0.1443 | 0.1480 | 0.1517 |
| 0.4 | 0.1554 | 0.1591 | 0.1628 | 0.1664 | 0.1700 | 0.1736 | 0.1772 | 0.1808 | 0.1844 | 0.1879 |
| 0.5 | 0.1915 | 0.1950 | 0.1985 | 0.2019 | 0.2054 | 0.2088 | 0.2123 | 0.2157 | 0.2190 | 0.2224 |
| 0.6 | 0.2257 | 0.2291 | 0.2324 | 0.2357 | 0.2389 | 0.2422 | 0.2454 | 0.2486 | 0.2517 | 0.2549 |
| 0.7 | 0.2580 | 0.2611 | 0.2642 | 0.2673 | 0.2704 | 0.2734 | 0.2764 | 0.2794 | 0.2823 | 0.2852 |
| 0.8 | 0.2881 | 0.2910 | 0.2939 | 0.2967 | 0.2995 | 0.3023 | 0.3051 | 0.3078 | 0.3106 | 0.3133 |
| 0.9 | 0.3159 | 0.3186 | 0.3212 | 0.3238 | 0.3264 | 0.3289 | 0.3315 | 0.3340 | 0.3365 | 0.3389 |
| 1.0 | 0.3413 | 0.3438 | 0.3461 | 0.3485 | 0.3508 | 0.3531 | 0.3554 | 0.3577 | 0.3599 | 0.3621 |
| 1.1 | 0.3643 | 0.3665 | 0.3686 | 0.3708 | 0.3729 | 0.3749 | 0.3770 | 0.3790 | 0.3810 | 0.3830 |
| 1.2 | 0.3849 | 0.3869 | 0.3888 | 0.3907 | 0.3925 | 0.3944 | 0.3962 | 0.3980 | 0.3997 | 0.4015 |
| 1.3 | 0.4032 | 0.4049 | 0.4066 | 0.4082 | 0.4099 | 0.4115 | 0.4131 | 0.4147 | 0.4162 | 0.4177 |
| 1.4 | 0.4192 | 0.4207 | 0.4222 | 0.4236 | 0.4251 | 0.4265 | 0.4279 | 0.4292 | 0.4306 | 0.4319 |
| 1.5 | 0.4332 | 0.4345 | 0.4357 | 0.4370 | 0.4382 | 0.4394 | 0.4406 | 0.4418 | 0.4429 | 0.4441 |
| 1.6 | 0.4452 | 0.4463 | 0.4474 | 0.4484 | 0.4495 | 0.4505 | 0.4515 | 0.4525 | 0.4535 | 0.4545 |
| 1.7 | 0.4554 | 0.4564 | 0.4573 | 0.4582 | 0.4591 | 0.4599 | 0.4608 | 0.4616 | 0.4625 | 0.4633 |
| 1.8 | 0.4641 | 0.4649 | 0.4656 | 0.4664 | 0.4671 | 0.4678 | 0.4686 | 0.4693 | 0.4699 | 0.4706 |
| 1.9 | 0.4713 | 0.4719 | 0.4726 | 0.4732 | 0.4738 | 0.4744 | 0.4750 | 0.4756 | 0.4761 | 0.4767 |
| 2.0 | 0.4772 | 0.4778 | 0.4783 | 0.4788 | 0.4793 | 0.4798 | 0.4803 | 0.4808 | 0.4812 | 0.4817 |
| 2.1 | 0.4821 | 0.4826 | 0.4830 | 0.4834 | 0.4838 | 0.4842 | 0.4846 | 0.4850 | 0.4854 | 0.4857 |
| 2.2 | 0.4861 | 0.4864 | 0.4868 | 0.4871 | 0.4875 | 0.4878 | 0.4881 | 0.4884 | 0.4887 | 0.4890 |
| 2.3 | 0.4893 | 0.4896 | 0.4898 | 0.4901 | 0.4904 | 0.4906 | 0.4909 | 0.4911 | 0.4913 | 0.4916 |
| 2.4 | 0.4918 | 0.4920 | 0.4922 | 0.4925 | 0.4927 | 0.4929 | 0.4931 | 0.4932 | 0.4934 | 0.4936 |
| 2.5 | 0.4938 | 0.4940 | 0.4941 | 0.4943 | 0.4945 | 0.4946 | 0.4948 | 0.4949 | 0.4951 | 0.4952 |
| 2.6 | 0.4953 | 0.4955 | 0.4956 | 0.4957 | 0.4959 | 0.4960 | 0.4961 | 0.4962 | 0.4963 | 0.4964 |
| 2.7 | 0.4965 | 0.4966 | 0.4967 | 0.4968 | 0.4969 | 0.4970 | 0.4971 | 0.4972 | 0.4973 | 0.4974 |
| 2.8 | 0.4974 | 0.4975 | 0.4976 | 0.4977 | 0.4977 | 0.4978 | 0.4979 | 0.4979 | 0.4980 | 0.4981 |
| 2.9 | 0.4981 | 0.4982 | 0.4982 | 0.4983 | 0.4984 | 0.4984 | 0.4985 | 0.4985 | 0.4986 | 0.4986 |
| 3.0 | 0.4987 | 0.4987 | 0.4987 | 0.4988 | 0.4988 | 0.4989 | 0.4989 | 0.4989 | 0.4990 | 0.4990 |
| 3.1 | 0.4990 | 0.4991 | 0.4991 | 0.4991 | 0.4992 | 0.4992 | 0.4992 | 0.4992 | 0.4993 | 0.4993 |
| 3.2 | 0.4993 | 0.4993 | 0.4994 | 0.4994 | 0.4994 | 0.4994 | 0.4994 | 0.4995 | 0.4995 | 0.4995 |
| 3.3 | 0.4995 | 0.4995 | 0.4995 | 0.4996 | 0.4996 | 0.4996 | 0.4996 | 0.4996 | 0.4996 | 0.4997 |
| 3.4 | 0.4997 | 0.4997 | 0.4997 | 0.4997 | 0.4997 | 0.4997 | 0.4997 | 0.4997 | 0.4997 | 0.4998 |
| 3.5 | 0.4998 | 0.4998 | 0.4998 | 0.4998 | 0.4998 | 0.4998 | 0.4998 | 0.4998 | 0.4998 | 0.4998 |
| 3.6 | 0.4998 | 0.4998 | 0.4999 | 0.4999 | 0.4999 | 0.4999 | 0.4999 | 0.4999 | 0.4999 | 0.4999 |
| 3.7 | 0.4999 | 0.4999 | 0.4999 | 0.4999 | 0.4999 | 0.4999 | 0.4999 | 0.4999 | 0.4999 | 0.4999 |
| 3.8 | 0.4999 | 0.4999 | 0.4999 | 0.4999 | 0.4999 | 0.4999 | 0.4999 | 0.4999 | 0.4999 | 0.4999 |
Z Score Table (Left):
The left z-table shows the area to the left of Z.
| Z | 0.00 | 0.01 | 0.02 | 0.03 | 0.04 | 0.05 | 0.06 | 0.07 | 0.08 | 0.09 |
|---|---|---|---|---|---|---|---|---|---|---|
| 0.0 | 0.5000 | 0.5040 | 0.5080 | 0.0120 | 0.0160 | 0.0199 | 0.5239 | 0.0279 | 0.0319 | 0.0359 |
| 0.1 | 0.5398 | 0.5438 | 0.5478 | 0.5517 | 0.5557 | 0.5596 | 0.5636 | 0.5675 | 0.5714 | 0.5753 |
| 0.2 | 0.5793 | 0.5832 | 0.5871 | 0.5910 | 0.5948 | 0.5987 | 0.6064 | 0.1064 | 0.6103 | 0.6141 |
| 0.3 | 0.6179 | 0.6217 | 0.6255 | 0.6293 | 0.6331 | 0.6368 | 0.6406 | 0.6443 | 0.6480 | 0.6517 |
| 0.4 | 0.6554 | 0.6591 | 0.6628 | 0.6664 | 0.6700 | 0.6736 | 0.6772 | 0.6808 | 0.6844 | 0.6879 |
| 0.5 | 0.6915 | 0.6950 | 0.6985 | 0.7019 | 0.7054 | 0.7088 | 0.7123 | 0.7157 | 0.7190 | 0.7224 |
| 0.6 | 0.7257 | 0.7291 | 0.7324 | 0.7357 | 0.7389 | 0.7422 | 0.7454 | 0.7486 | 0.7517 | 0.7549 |
| 0.7 | 0.7580 | 0.7611 | 0.7642 | 0.7673 | 0.7704 | 0.7734 | 0.7764 | 0.7794 | 0.7823 | 0.7852 |
| 0.8 | 0.7881 | 0.7910 | 0.7939 | 0.7967 | 0.7995 | 0.8023 | 0.8051 | 0.8078 | 0.8106 | 0.8133 |
| 0.9 | 0.8159 | 0.8186 | 0.8212 | 0.8238 | 0.8264 | 0.8289 | 0.8315 | 0.8340 | 0.8365 | 0.8389 |
| 1.0 | 0.8413 | 0.8438 | 0.8461 | 0.8485 | 0.8508 | 0.8531 | 0.8554 | 0.8577 | 0.8599 | 0.8621 |
| 1.1 | 0.8643 | 0.8665 | 0.8686 | 0.8708 | 0.8729 | 0.8749 | 0.8770 | 0.8790 | 0.8810 | 0.8830 |
| 1.2 | 0.8849 | 0.8869 | 0.8888 | 0.8907 | 0.8925 | 0.8944 | 0.8962 | 0.8980 | 0.8997 | 0.9015 |
| 1.3 | 0.9032 | 0.9049 | 0.9066 | 0.9082 | 0.9099 | 0.9115 | 0.9131 | 0.9147 | 0.9162 | 0.9177 |
| 1.4 | 0.9192 | 0.9207 | 0.9222 | 0.9236 | 0.9251 | 0.9265 | 0.9279 | 0.9292 | 0.9306 | 0.9319 |
| 1.5 | 0.9332 | 0.9345 | 0.9357 | 0.9370 | 0.9382 | 0.9394 | 0.9406 | 0.9418 | 0.9429 | 0.9441 |
| 1.6 | 0.9452 | 0.9463 | 0.9474 | 0.9484 | 0.9495 | 0.9505 | 0.9515 | 0.9525 | 0.9535 | 0.9545 |
| 1.7 | 0.9554 | 0.9564 | 0.9573 | 0.9582 | 0.9591 | 0.9599 | 0.9608 | 0.9616 | 0.9625 | 0.9633 |
| 1.8 | 0.9641 | 0.9649 | 0.9656 | 0.9664 | 0.9671 | 0.9678 | 0.9686 | 0.9693 | 0.9699 | 0.9706 |
| 1.9 | 0.9713 | 0.9719 | 0.9726 | 0.9732 | 0.9738 | 0.9744 | 0.9750 | 0.9756 | 0.9761 | 0.9767 |
| 2.0 | 0.9772 | 0.9778 | 0.9783 | 0.9788 | 0.9793 | 0.9798 | 0.9803 | 0.9808 | 0.9812 | 0.9817 |
| 2.1 | 0.9821 | 0.9826 | 0.9830 | 0.9834 | 0.9838 | 0.9842 | 0.9846 | 0.9850 | 0.9854 | 0.9857 |
| 2.2 | 0.9861 | 0.9864 | 0.9868 | 0.9871 | 0.9875 | 0.9878 | 0.9881 | 0.9884 | 0.9887 | 0.9890 |
| 2.3 | 0.9893 | 0.9896 | 0.9898 | 0.9901 | 0.9904 | 0.9906 | 0.9909 | 0.9911 | 0.9913 | 0.9916 |
| 2.4 | 0.9918 | 0.9920 | 0.9922 | 0.9925 | 0.9927 | 0.9929 | 0.9931 | 0.9932 | 0.9934 | 0.9936 |
| 2.5 | 0.9938 | 0.9940 | 0.9941 | 0.9943 | 0.9945 | 0.9946 | 0.9948 | 0.9949 | 0.9951 | 0.9952 |
| 2.6 | 0.9953 | 0.9955 | 0.9956 | 0.9957 | 0.9959 | 0.9960 | 0.9961 | 0.9962 | 0.9963 | 0.9964 |
| 2.7 | 0.9965 | 0.9966 | 0.9967 | 0.9968 | 0.9969 | 0.9970 | 0.9971 | 0.9972 | 0.9973 | 0.9974 |
| 2.8 | 0.9974 | 0.9975 | 0.9976 | 0.9977 | 0.9977 | 0.9978 | 0.9979 | 0.9979 | 0.9980 | 0.9981 |
| 2.9 | 0.9981 | 0.9982 | 0.9982 | 0.9983 | 0.9984 | 0.9984 | 0.9985 | 0.9985 | 0.9986 | 0.9986 |
| 3.0 | 0.9987 | 0.9987 | 0.9987 | 0.9988 | 0.9988 | 0.9989 | 0.9989 | 0.9989 | 0.9990 | 0.9990 |
Get the z value statistic by using the calculator and find it in the given z table.
Z scores and Standard Deviations:
Technically, the z value or Z score is the number of standard deviations from the mean value.
For example:
A z score of -3.1 is -3.8 standard deviations below the mean. A z score of 4 is 4 standard deviations above the mean. The standardized value (Z score) determines where the score lies on the normal distribution curve.
How is Z score used in real life?
The z statistics score of a number depicts the number’s “relative standing” in a given data set. Relative standing is referred to as a measure of how many standard deviations above, or below, a data value is from the mean. For example, let’s there a data set that consists of the heights of 10-year-old girls.
How to Find Z Score (Step-by-Step):
Calculating z score value step-by-step value becomes handy if you know the exact z score equation, let's look at the given solved example for better understanding. However, our z score calculator also calculates the z-statistics value for the given data point. Swipe on!
Example: Calculating Z-Score
Suppose we have a dataset with a population mean of \(\mu = 4\) and a standard deviation of \(\sigma = 2\). We want to find the Z-score for a data point \(x = 9\).
Solution:
The Z-score formula is:
\[ z = \frac{x - \mu}{\sigma} \]
Substitute the values:
\[ z = \frac{9 - 4}{2} \] \[ z = \frac{5}{2} \] \[ z = 2.5 \]
So, the Z-score of the data point \(x = 9\) is:
\[ \mathbf{z = 2.5} \]
This means the data point is 2.5 standard deviations above the mean. You can similarly calculate Z-scores for other data points using the same formula, and visualize results with a graph for better understanding.
How to Use Z Score Calculator:
Finding z score with formula is a time taking process. Thanks to the free online z score calculator that performs z-value calculations for the given raw score within a couple of seconds. Read on!
Inputs:
- First of all, choose the statistic parameter from which you want to do calculate z score
- Very next, enter all the data according to the selected parameter
- Lastly, hit the calculate button
Outputs: The z statistic calculator finds:
- Z score of input dataset
- Z score graph
- Left tailed p value
- Right tailed p value
- Two tailed p value
- Two tailed confidence level
- Step-by-Step calculation
Note: It doesn't matter at all through which point you are going to calculate z score value, the z-score finder calculates the standard statistics parameters according to the entered values.
Conclusion:
Thankfully, you come to know how our z value calculator helps you to find the z standard value. When it comes to investing, the standard deviation (SD) and the z- score can be useful statistics parameters in determining market volatility. Remember that if the SD increases, it referred to as that the price action varies widely within the given time frame. From the given information, the z stat score of a particular price referred to as how typical or atypical this movement depends on previous performance. The calculator-online specifically developed this z-score calculator for statisticians, students, and laymen to solve their z statistics problems.
References:
From the authorized source of Wikipedia : Definition & applications From the site of investopedia : Standard deviation & z score From the site of khanacademy : General formulas for the calculation of z score
Related Tools