P-Hat Calculator
Input the sample size and the number of occurrences into the calculator and click on "Calculate" to determine p-hat (p̂).
P-Hat Calculator
Using this p-hat calculator helps to find the sample proportion based on the number of occurrences of an event and sample size. This tool would be used to get calculations in steps. P-hat is essential for further statistical analysis, like determining the margin of error.
What is P Hat in Statistics?
In statistics, p̂ is a fundamental value that shows the frequency of a certain event to the total number of observations in the sample.
P hat symbol:
P-hat is generally written as p̂, with a “hat”
It is used to show the proportion of a sample with a particular outcome. Generally, this is utilized in polls to find how many people in the country agree or disagree with a certain decision, idea, or policy.
P Hat Formula:
P-hat (p̂) is calculated by dividing the number of occurrences/trials by the sample size. To calculate the p-hat use the equation below:
p̂ = x n
Where:
- p̂ = Sample proportion
- x = Number of occurrences in the sample
- n = Sample size
How to Find P Hat?
P-hat denotes the probability of an event but when there is a large population is taken, then it is difficult to measure. Therefore, have a look at the example below to make the concept clear.
Example:
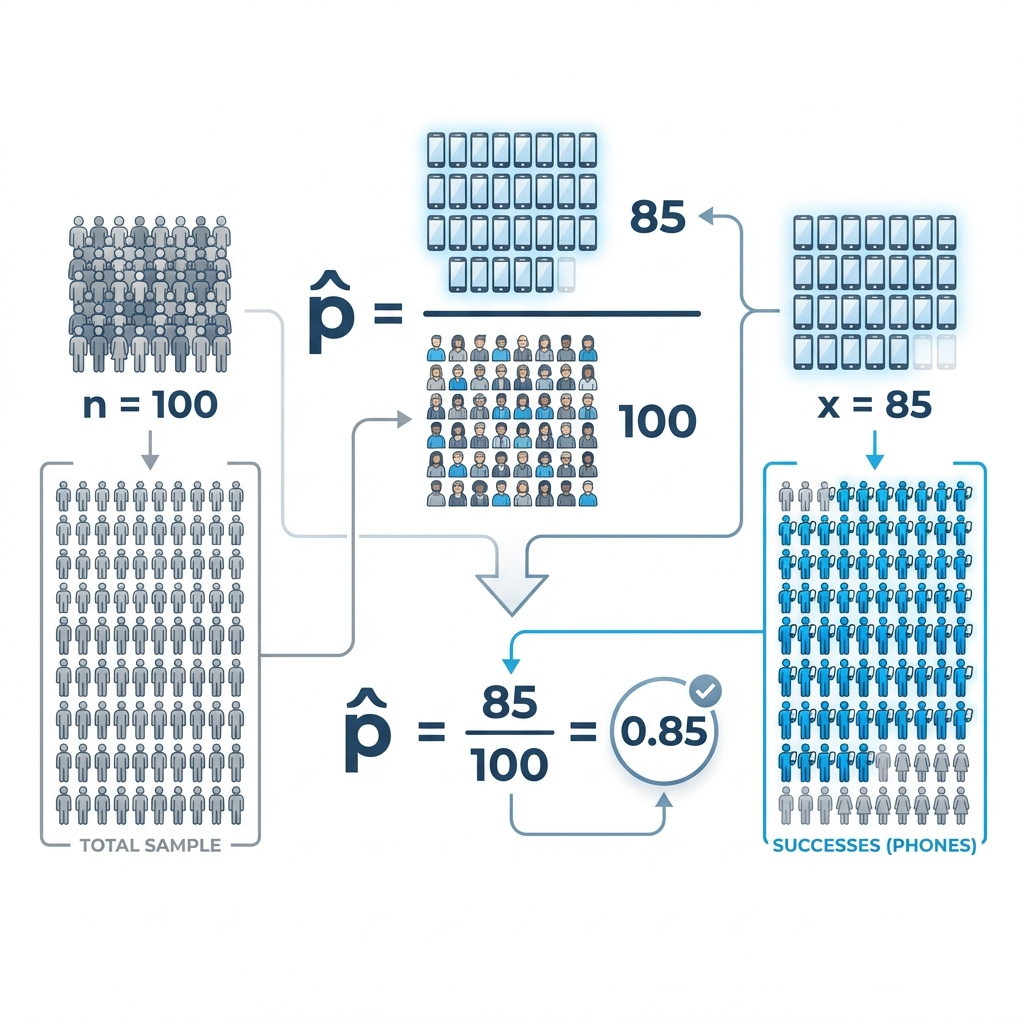
Let's say you want to estimate the proportion of people in a city who own a smartphone. You conducted a survey of 100 people and found that 85 of them owned a smartphone.
Given Values:
- Sample size (n) = 100
- Number of successes (x) = 85
Calculation:
p̂ = x n
p̂ = 85 100
p̂ = 0.85
Interpretation:
The estimated proportion of people in the city who own a smartphone is 0.85. The result is also reported in the percentage which can make, 0.85 x 100 = 85%. To make the calculations more simple, you can use the online p-hat calculator that finds the sample proportion by just putting the values into their designed fields.
FAQs:
How does sample size affect p-hat?
A large sample size leads to a more accurate estimation of p-hat.
Can p-hat be negative?
No, p-hat cannot be negative. It is a proportion, which ranges from 0 to 1.
What are the applications of P-hat?
P-hat has a range of applications including public opinion polls & market research, hypothesis testing & constructing confidence intervals, quality control, or social sciences, where understanding and quantifying proportions is essential.
Related Tools