Percentile Calculator
Enter the number in designated fields. The calculator will calcualte stem and leaf values along with other statistical parameters (minimum, maximum, range, count, sum, median, mode, standard deviation, and variance).
Make a use of this free percentile calculator to perform percentile calculations that you are actually looking for. Whatever the kth score value in a data set is, this calculator works on the function as defined by Google Sheets, Apple numbers, or Excel sheets to determine it in seconds. Ok well, let’s move on to discuss this concept in a brief detail. Stay focused!
What Is Percentile?
A particular value that represents the position of a value in a data set with respect to all values present in it.
How To Find Percentile In Stats?
You can find the percentile by various methods. Here we will be discussing three ways that result in genuine percentile calculation and are as follows:
Method 1:
This method briefs that:
- Suppose you have a data set in which various values are sorted in ascending order. Now if you are interested to find the percentile for the data value, then this pth percentile is the lowest value in the data set from which N percentage of all values are smaller.
-
This method uses the nearest-rank method, in which you first determine the ordinal rank of the data set. After that, the required rank is calculated using the formula below:
\( n = \left\lceil \frac{P}{100} \times N \right\rceil , \quad 0 < P \le 100 \)
- When you are done with it and calculate rank as a decimal number, you need to round it off to the next highest integer. This will give you the percentile of the chosen number.
The free percentile calculator statistics also takes into consideration all terms and values mentioned in this method.
Method 2:
This method is called “and and next method”. This method states that:
- You need to find the linear interpolation between two numbers that are close by to each other.
-
After that, you are required to find the fractional rank using the following expression:
\( x = \frac{P}{100}(N - 1) + 1, \quad 0 < P \le 100 \)
- After you do this stuff, round off the answer calculated to the highest value that does not exceed the answer calculated.
- Then, this fractional part x is further used in finding percentiles by using two values. First value is the ordinal rank \(V_{n}\) and the next value is \(V_{n} + 1\).
$$ V_{x} = V_{n} + x \left(v_{n+1} - v_{n}\right), when P<100 $$
$$ V{x} = V_{n}, when P=100 $$
- And by the definition, we have the fractional part as follows: $$ {x} = x - [x] $$
Method 3:
This method is another alternative of the second method. This method explains that:
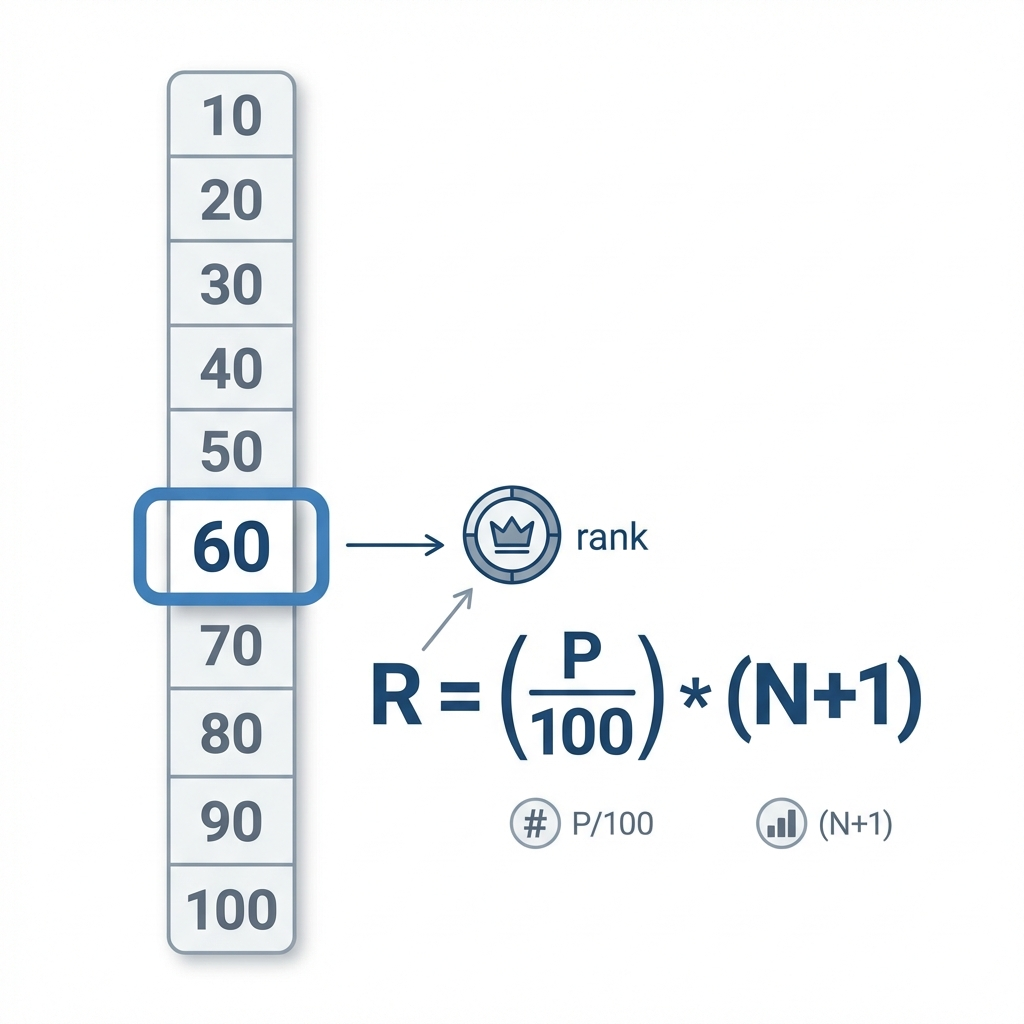
- You need to find the fractional rank by using the formula below:
$$ x = [\frac{P}{100}*\left(N+1\right)], \frac{100}{N+1} $$
- Keep in mind that this method is an exclusive one. If the pth percentile falls beyond the data, then you will not get the answer. The percentile rank calculator also displays an error which satisfies this condition.
- Next, the method to find the percentile is the same as aforementioned in Method 2. But let us explore here too. You are now required to calculate percentile by using the equations as below: $$ V_{x} = V_{n} + x \left(v_{n+1} - v{n}\right) $$
- At the end, the fractional part that represents the percentile is given as follows: $$ {x} = x - [x] $$
Our best find percentile calculator also follows the terms defined in this method and displays error if the percentile value lies beyond the data set range.
How To Find The Percentile of A Data Set?
Let’s resolve an example in this section to understand how you can use various methods as described above to calculate percentile. Stay with it!
Example # 01:
You have a data set as given below in the table:
| Value | Rank |
| 2 | 1 |
| 44 | 2 |
| 3 | 3 |
| 54 | 4 |
| 33 | 5 |
| 22 | 6 |
| 12 | 7 |
| 5 | 8 |
Calculate 90th percentile for the given set of values by using method 1.
Solution:
The most optimal way of finding the required percentile is by using our best 90th percentile calculator. But here we will be calculating it manually. Let’s go! Here using method 1, we have:
Given data set: 2, 44, 3, 54, 33, 22, 12, 5
Sorted data: 2, 3, 5, 12, 22, 33, 44, 54
Now we have:
$$ n = [\frac{P}{100}*N] $$
$$ n = [\frac{90}{100}*8] $$
$$ n = [0.9*5] $$
$$ n = 7.2 $$
Here this number will be rounded off to its next high integer value that will tell us the percentile value.
$$ n = 8 $$
At n = 8, the value without ceiling is 54 which is the calculated percentile. But the actual 90th percentile against 7.2 would be 47.
How Percentile Calculator Works?
Let’s have a look at how this free percentiles calculator takes a couple of seconds to calculate percentiles online of any value contained within the data set range.
Input:
- Enter your data set separated with commas or new line or spaces
- After that, enter the percentile that you wish to determine within the data set
- If you are willing to get a listing of each 5th percentile that contain quartiles and deciles, click this portion available on the calculator
- At the end, tap the calculate button
Output: The free 75th percentile calculator calculates:
- Percentile value by using all methods as aforementioned in the read above
- Display the listing that shows all percentiles of the data set with the difference of 5.
FAQ’s:
What do you mean by the 90th percentile?
If you are having a score at the 90th percentile, it means that 90 percent of the scores are there that lie in the positions less than the score at 90th number. Rest of the score lie in positions higher than this percentile and are only 10 percent.
Is the 95th percentile the top 5 percent?
95th percentile displays the value that is actually lying behind the remaining 5% values in the data set.
How do you calculate percentile in excel?
To calculate the rank percentile of a list data, you can use a formula in excel that is as follows:
\( R = \frac{\text{EQ}(X,\text{Data},1)}{N} \)
Now hit the enter button to calculate all possible rank percentiles.
What is the 60th percentile for the data set given below: 2, 76, 45, 6, 3
The 60th percentile for this data range is 22 that you could also cross check by using this 60th percentile calculator.
What is a real life example of percentile?
Suppose an old man has a height of 5 feet and 7 inches. As the old man is in the highest age ranges, the height is considered as the 99th percentile of him.
What is the importance of percentile rank?
Percentile rank shows the behaviour of a certain value with respect to the others all. For example; if some students appeared in a test, then a percentile rank for any student wi;ll be a representation of its performance with respect to all other students.
Last Words:
It is true that there is no method that could calculate percentile authentically, but it has many advantages too. Just suppose you are supposed to break the data set in smaller parts and perform various statistical operations on them. You can never do that unless or until you learn to find the scores either manually or by using a percentile calculator stats. We hope this reading would be beneficial for you.
References:
From the source of wikipedia: Percentile, Applications, The normal distribution and percentiles, The nearest-rank method, The linear interpolation between closest ranks method From the source of khan academy: percentile From the source of lumen learning: Box Plots, Interpreting Percentiles, Quartiles, and Median
Related Tools