Variance Calculator
Enter your data set values and the calculator will instantly calculate their variance (sample or population), coefficient of variation, and the sum of squares, with detailed calculations shown.
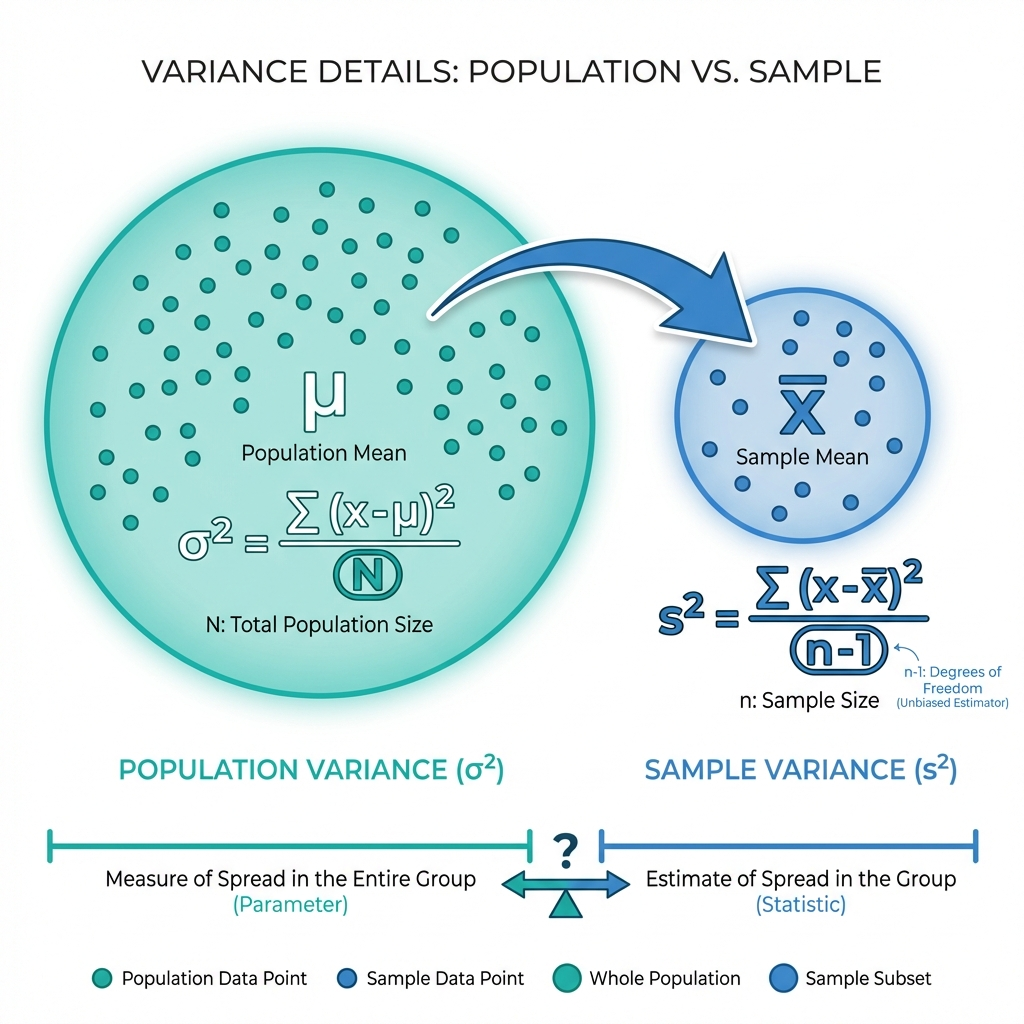
What is a Variance?
The variance of a group or set of numbers is a number that represents the ‘spread’ of the set. Formally, this is the square of deviation in the set from the mean and the square of the standard deviation. In other words, a small variance means that the data points tend to be close to the mean and very close to each other. A high variance indicates that the data points are far away from the mean and each other. The variance is the mean of the square of the distance from each point to the mean.
Types of Variance:
Sample Variance: The variance of the sample does not cover the entire possible sample (a random sample of people).
Population Variance: The variance which is measured from the whole population (for example, all people).
However, the online Standard Deviation Calculator allows you to determine the standard deviation (σ) and other statistical measurements of the given dataset.
Variance Formulas
Population Variance Formula
Variance (denoted as \(\sigma^2\)) measures the average squared deviation of each data point from the population mean. The formula is:
\[ \sigma^2 = \frac{\sum_{i=1}^{N} (x_i - \mu)^2}{N} \]
Where:
- \(\sigma^2\) = population variance
- \(\mu\) = population mean
- \(x_i\) = the i-th data point
- N = total number of data points in the population
Steps to calculate population variance:
- Find the difference between each data point and the mean: \(x_i - \mu\)
- Square each difference: \((x_i - \mu)^2\)
- Take the mean of these squared differences: \(\sigma^2 = \frac{\sum (x_i - \mu)^2}{N}\)
Sample Variance Formula
When working with a sample instead of the full population, the sample variance is calculated as:
\[ s^2 = \frac{\sum_{i=1}^{n} (x_i - \bar{x})^2}{n - 1} \]
Where:
- \(s^2\) = sample variance
- \(\bar{x}\) = sample mean
- \(x_i\) = the i-th data point in the sample
- n = sample size
How to Calculate Variance?
To calculate variance, follow these steps:
- Find the mean of the data set: For a dataset \(x_1, x_2, \dots, x_n\), the sample mean is:
\[ \bar{x} = \frac{\sum_{i=1}^{n} x_i}{n} \]
Next, find the difference of each data value from the mean and square it:
\[ (x_i - \bar{x})^2 \]
Then, calculate the sum of these squared differences (sum of squares):
\[ S = \sum_{i=1}^{n} (x_i - \bar{x})^2 \]
Finally, compute the variance:
- Population variance: \[ \sigma^2 = \frac{\sum_{i=1}^{N} (x_i - \mu)^2}{N} \]
- Sample variance: \[ s^2 = \frac{\sum_{i=1}^{n} (x_i - \bar{x})^2}{n - 1} \]
These formulas can be calculated manually or using a sample variance calculator.
Example:
Find the variance of five students' exam scores: 50, 75, 89, 93, 93.
- Find the mean:
\[ \bar{x} = \frac{50 + 75 + 89 + 93 + 93}{5} = \frac{400}{5} = 80 \]
Next, compute the squared differences from the mean:
\[ (50 - 80)^2 = (-30)^2 = 900 \] \[ (75 - 80)^2 = (-5)^2 = 25 \] \[ (89 - 80)^2 = 9^2 = 81 \] \[ (93 - 80)^2 = 13^2 = 169 \]
Sum these squared differences:
\[ S = 900 + 25 + 81 + 169 + 169 = 1344 \]
Finally, compute the sample variance (n = 5):
\[ s^2 = \frac{S}{n-1} = \frac{1344}{5-1} = \frac{1344}{4} = 336 \]
So, the sample variance is:
\[ s^2 = 336 \]
- Calculate the differences from the mean and square them:
We already found the mean: \(\bar{x} = 80\). Now, for each data point \(x_i\), calculate the deviation from the mean:
\[ x_i - \bar{x} \]
For the first data point \(x_1 = 50\):
\[ 50 - 80 = -30 \]
Next, square this deviation to find the squared difference:
\[ (x_1 - \bar{x})^2 = (-30)^2 = 900 \]
In the table below, the squared deviation calculated from the mean of all test results. The "Mean Deviation" column is the score minus 30, and the "Standard Deviation" column is the column before the square.
| Score | Deviation from the mean | Squared deviation |
| 50 | -30 | 900 |
| 75 | -5 | 25 |
| 89 | 9 | 81 |
| 93 | 13 | 169 |
| 93 | 13 | 169 |
- Calculate the standard deviation and variance
Next, use the squared deviations from the mean:
σ2 = ∑(xi - x̄)2 / N
σ2 = (900 + 25 + 81 + 169 + 169) / 5
σ2 = 268.5
The exam scores' variance was 268.8.
How Variance Calculator Works?
An online population variance calculator computes variance for given data sets. You can view the work done for the calculation from the dataset by following these instructions:
Input:
- First, enter data set values separated with a comma
- Then, select variance for a sample or population set
- Hit the calculate button for getting the results
Output:
- The sample variance calculator displays variance, standard deviation, count, sum, mean, coefficient of variance, and the sum of squares
- This calculator also provides step-by-step calculations for variance, coefficient of variance, and standard deviation
FAQ:
What is the difference between standard deviation and variance?
The variance is the squared deviation of the mean, and the standard deviation is the square root of the number. Both indicators reflect the variability of the distribution, but their units are different: the standard deviation is determined in the same unit as the original value (for example, minutes or meters).
Is high variance value bad or good?
Low variance is associated with lower risk and lower return. High-variance stocks are generally beneficial to aggressive investors with lower risk aversion, while low-variance stocks are generally beneficial to conservative investors with lower risk tolerance.
What is the range of variance?
The range is the difference between the high value and the low value. Since only extreme values are used because these values will greatly affect it. For finding the range of variance, take the maximum value and subtract the minimum value.
Conclusion:
Use this online variance calculator which works for both sample and population datasets using population and sample variance formula. This is the best educational calculator that tells you how to calculate the variance of given datasets in a fraction of a second.
Related Tools