Covariance Calculator
Select the parameter and input values of statistical variables X and Y to compute their covariance with the help of this calculator.
Our covariance calculator is a statistics tool that estimates the covariance between two random variables X and Y in probability & statistics experiments. Moreover, you need this covariance statistics calculator, if you want to:
- Calculate Covariance From Dataset
- Calculate Covariance From Correlation Coefficient
- Compute Covariance Matrix
In this article, you will learn about the covariance formula, how to calculate covariance, and much more that you need to know! Well, before knowing about this covariance calculator, let’s start with some basics.
What is Covariance?
In the term of statistics and mathematics, covariance definition elaborates as the measurement of the relationship between two random variables (X, Y). In simple words, covariance is said to be a measure of how much two random variables can vary together. Studies depict that the covariance concept is very similar to the variance concept. However, the statistical covariance tells you how two variables vary together while statistical variance tells you how a single variable varies. Well, calculating covariance becomes easy with the help of the above covariance calculator.
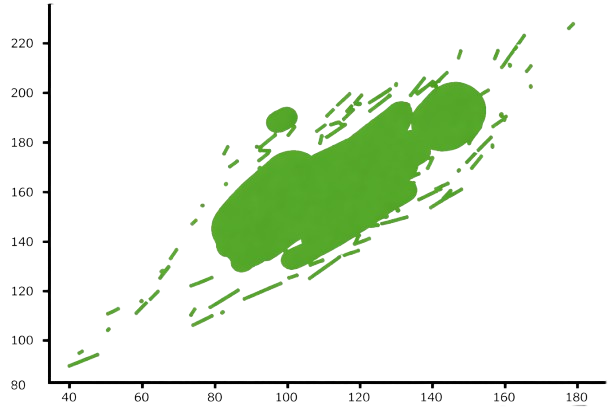
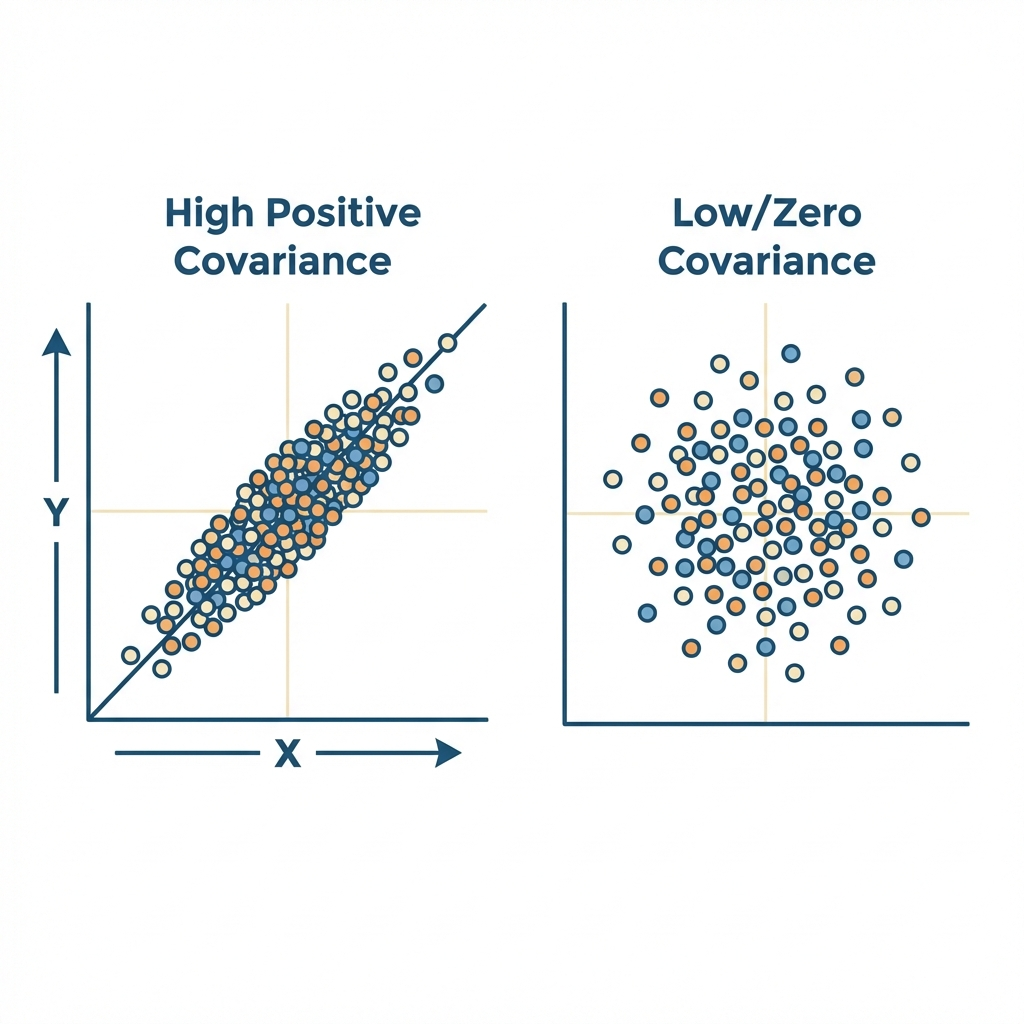
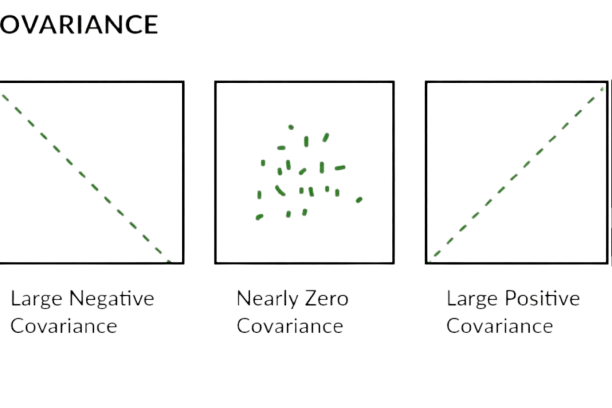
Covariance can be positive or negative. Positive covariance means the two data sets are likely to move in the same way. While a negative covariance indicates that as one data set rises, the other tends to fall. You can also find the sum of squares of a given dataset by using this online sum of squares calculator.
Covariance Formula:
Our covariance calculator with probability helps you in statistics measurements by using the given sample and population covariance formulas:
Sample Covariance Formula:
\[ \text{Cov}_{\text{sample}}(X, Y) = \frac{\sum_{i=1}^{N} (x_i - \bar{x})(y_i - \bar{y})}{N - 1} \]
Population Covariance Formula:
\[ \text{Cov}_{\text{population}}(X, Y) = \frac{\sum_{i=1}^{N} (x_i - \bar{x})(y_i - \bar{y})}{N} \]
In the above covariance equations;
- \(\Sigma\): Summation notation
- \(x_i\): Set of observations of X
- \(y_i\): Set of observations of Y
- \(\bar{x}\) and \(\bar{y}\): Sample means
- N: Total number of observations in the data set
Mean of X:
\[ \bar{x} = \frac{1}{n} \sum_{i=1}^{n} x_i \]
Mean of Y:
\[ \bar{y} = \frac{1}{n} \sum_{i=1}^{n} y_i \]
The covariance calculator helps to find out the statistical relationship between the two sets of population data (X and Y). Also, this sample covariance calculator allows you to calculate covariance matrix and the covariance between two variables X and Y for a given correlation coefficient (Pearson’s) and standard deviations. Don’t fret; covariance calculation is quite easy with this advanced covariance statistics tool.
Read on!
How to Use This Covariance Calculator?
Our statistics calculator is quite easy to use, you just have to follow the given steps:
Input:
- Select the sample or population covariance option from the drop-down menu
- Enter the values of the data set X separated by commas
- Enter the values of the data set Y separated by commas
Once you have added the above values, hit the calculate button, the covariance calculator shows the step-by-step solution in a couple of seconds:
Output:
Automatic Mean Calculation
Auto-calculates and displays the mean of both X and Y datasets.
Choose Covariance Type
Use a simple toggle option to select between sample or population covariance
Formula Display
Displays the mathematical formula used for covariance.
Calculate Means
Find the Mean for Dataset X and also the Mean for Dataset Y
Data Table
Provides a detailed table showing the deviations from the mean and their product:
Specifically, the table includes: \[ (X_i - \bar{X}), \quad (Y_i - \bar{Y}), \quad \text{and } (X_i - \bar{X})(Y_i - \bar{Y}) \]
Step-by-Step Solution
Explains how the final covariance value is computed. The final covariance value is clearly highlighted.
How to Calculate Covariance (Example)?
Let’s take a look at covariance example:
Calculate the covariance for the given data sets.
- X = 4, 7, 10, 13, 16
- Y = 1, 3, 5, 7, 9
Step 1: Find the sample mean of data sets X & Y.
For X:
\[ \bar{X} = \frac{4 + 7 + 10 + 13 + 16}{5} \]
\[ \bar{X} = \frac{50}{5} = 10 \]
For Y:
\[ \bar{Y} = \frac{1 + 3 + 5 + 7 + 9}{5} \]
\[ \bar{Y} = \frac{25}{5} = 5 \]
Step 2: Now find the deviation (difference of data values from the mean) of sets X & Y and calculate the square of deviations.
| \(x_i\) | \(x_i - \bar{X}\) | \(y_i\) | \(y_i - \bar{Y}\) | \((x_i - \bar{X})(y_i - \bar{Y})\) |
|---|---|---|---|---|
| 4 | \(4 - 10 = -6\) | 1 | \(1 - 5 = -4\) | \((-6) \cdot (-4) = 24\) |
| 7 | \(7 - 10 = -3\) | 3 | \(3 - 5 = -2\) | \((-3) \cdot (-2) = 6\) |
| 10 | \(10 - 10 = 0\) | 5 | \(5 - 5 = 0\) | \((0) \cdot (0) = 0\) |
| 13 | \(13 - 10 = 3\) | 7 | \(7 - 5 = 2\) | \((3) \cdot (2) = 6\) |
| 16 | \(16 - 10 = 6\) | 9 | \(9 - 5 = 4\) | \((6) \cdot (4) = 24\) |
Step 3: Calculate the summation of \((x_i - \bar{X})(y_i - \bar{Y})\) terms.
\[ \sum_{i=1}^{5} (x_i - \bar{X})(y_i - \bar{Y}) = 24 + 6 + 0 + 6 + 24 \]
\[ \sum_{i=1}^{5} (x_i - \bar{X})(y_i - \bar{Y}) = 60 \]
Step 4: Divide the summation by \(N - 1\) to get the sample covariance.
\[ \text{Cov}_{\text{sample}}(X,Y) = \frac{\sum_{i=1}^{5} (x_i - \bar{X})(y_i - \bar{Y})}{N - 1} = \frac{60}{5 - 1} = \frac{60}{4} = 15 \]
Final Answer: Sample Covariance = 15
However, from this example you got a positive covariance, it means that the variables are positively related.
Note:
If you see the given denominator of the above covariance formula, you have the degrees of confidence. However, in the above covariance example, we had more than 2 terms, thus we used the formula n – 1. When you are going to find the covariance of two random variables, then you ought to divide the formula by n only.
Interpretation of Covariance:
From the above example of covariance you will come to know, if you had a positive covariance, which means there is a positive relationship between the variables or that said they are positively related. However, you can use our covariance calculator to calculate covariance from correlation. As a rule of thumb, a large covariance indicates that there may be a strong relationship between variables. Nevertheless, remember that you can’t compare variances over data sets that have several scales. You just have to think about comparing two datasets of variables where one is expressed in inches and the other one in pounds.
This is the problem with the interpretation of covariance outcomes, so as a far better approach is to account the correlation coefficient. So, you have to use the following formula instead:
Corr(X,Y) = Cov(X,Y) σXσY
However, you can confirm your outcomes in our calculate covariance from correlation.
Covariance vs Correlation:
Let’s start with covariance:
- Covariance is something that indicates the measurement between two random variables X and Y
- Covariance is a measurement of correlation
- Values of covariance exist between –x and +x
- Change in scale will affects the value of the covariance
- Remember that covariance always has units
Now, ahead to Correlation:
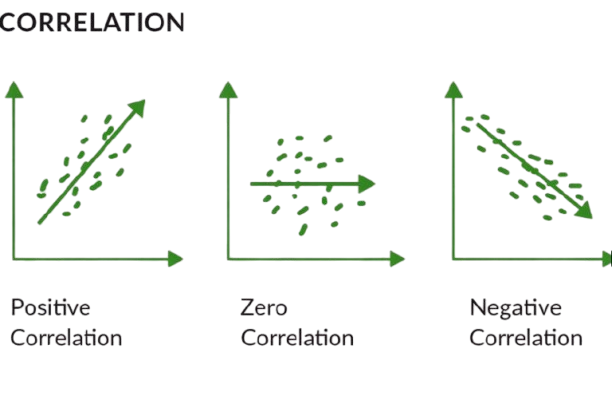
- Correlation is something that indicates the measurement that how strongly two variables are related
- Correlation is said to be a scaled version of covariance
- Values of correlation exist between -1 and +1
- Change in scale does not affect the value of the correlation
- Remember that correlation does not have units
Advantages of the Correlation Coefficient over Covariance:
The Correlation Coefficient has a different number of advantages over covariance for computing strengths of relationships, these are:
- Covariance can account on practically any number while a correlation is limited: -1 to +1
- Correlation is more useful for finding how strong the relationship is between the two variables, just because of its numerical limitations
- Correlation is not at all affected by changes in the center that is said to be the mean or scale of the variable
Frequently Asked Questions:
Can covariance be negative?
Unlike variance, which is non-negative, Covariance is something that can be negative or positive (or zero, of course). A positive covariance indicates that two random variables tend to vary in the same direction; a negative variance indicates that they vary in opposite directions, and zero means they don’t vary together.
What is the symbol for covariance?
The symbol for covariance is cov(X, Y).
What is the maximum value of covariance?
When it comes to covariance, there is no minimum or maximum value, that’s why the values are more difficult to interpret. For instance, a covariance of 50 may indicate a strong or weak relationship as this actually depends on the units in which covariance is measured.
What is the range of covariance?
Covariance values are not standardized, according to statistical terms, the covariance can range from negative infinity to positive infinity. Thus, the value for a perfect linear relationship all depends on the data.
Should I use correlation or covariance?
When it comes to compare data samples from different populations, the covariance (COV) is considered to find how much two random variables vary together. And, correlation is something that accounts to find when a change in one variable can result in a change in another. Remember that both covariance and correlation determine linear relationships between variables.
Why is correlation preferred over covariance?
Well, when it comes to comparison, which is a better measure of the relationship between two variables, correlation is preferred over covariance as it is the measure that remains unaffected by the change in location and scale – and, also can be accounted to make a comparison between two pairs of variables.
How to create covariance matrix in excel?
Just stick to these given steps to create a covariance matrix in Excel or covariance table in Excel:
- Step 1: You have to make a click to the data analysis on the top right corner of the data tab
- Step 2: You have to choose covariance and click ok
- Step 3: In this step, you should have to click in the input range box and choose the range A1:C10, then select the “Labels in first row” tick box and output range and finally click ok
What is variance?
Variance is the mathematical term used in statistics and probability theory, it is referred to the spread of a dataset around its mean value.
Is covariance linear?
Sometimes the covariance is said to be a measure of ‘linear dependence’ between the two random variables. That does not mean the same thing that is in the context of linear algebra.
References:
From Wikipedia, the free encyclopedia - For a broader coverage of this topic, see Covariance and Correlation Coefficient
From dummies - Business Statistics By Alan Anderson - how to calculate Covariance and Correlation of Data Samples
An initiative by IIT IIM Graduates, EDUCBA (Corporate Bridge Consultancy Pvt Ltd) - Covariance Formula with Example - Population Covariance & Sample Covariance From XPLAIND
Related Tools