Poisson Distribution Calculator
Enter the average rate of occurrence (λ), Poisson random variable (x), and select the type of probability (exact, cumulative, or complement) to find the probability of an event happening.
What Is Poisson Distribution?
This distribution helps to predict the probability of how many times a specific number of events can occur within a fixed interval (space or time).
Example: Imagine counting the number of people passing through a walkthrough gate in one minute. Poisson distribution helps determine the probability of a specific number of people passing through during the defined duration.
Properties of Poisson Distribution:
- All events occur independently of each other.
- Two events cannot occur at the same time.
- Mean: \(E(X) = \lambda\) and Variance: \(V(X) = \lambda\).
- The average rate of occurrence (\(\lambda\)) remains constant over time, where \(n p = \lambda\).
- The standard deviation is the square root of the mean: \(\sigma = \sqrt{\lambda}\).
Poisson Distribution Formula:
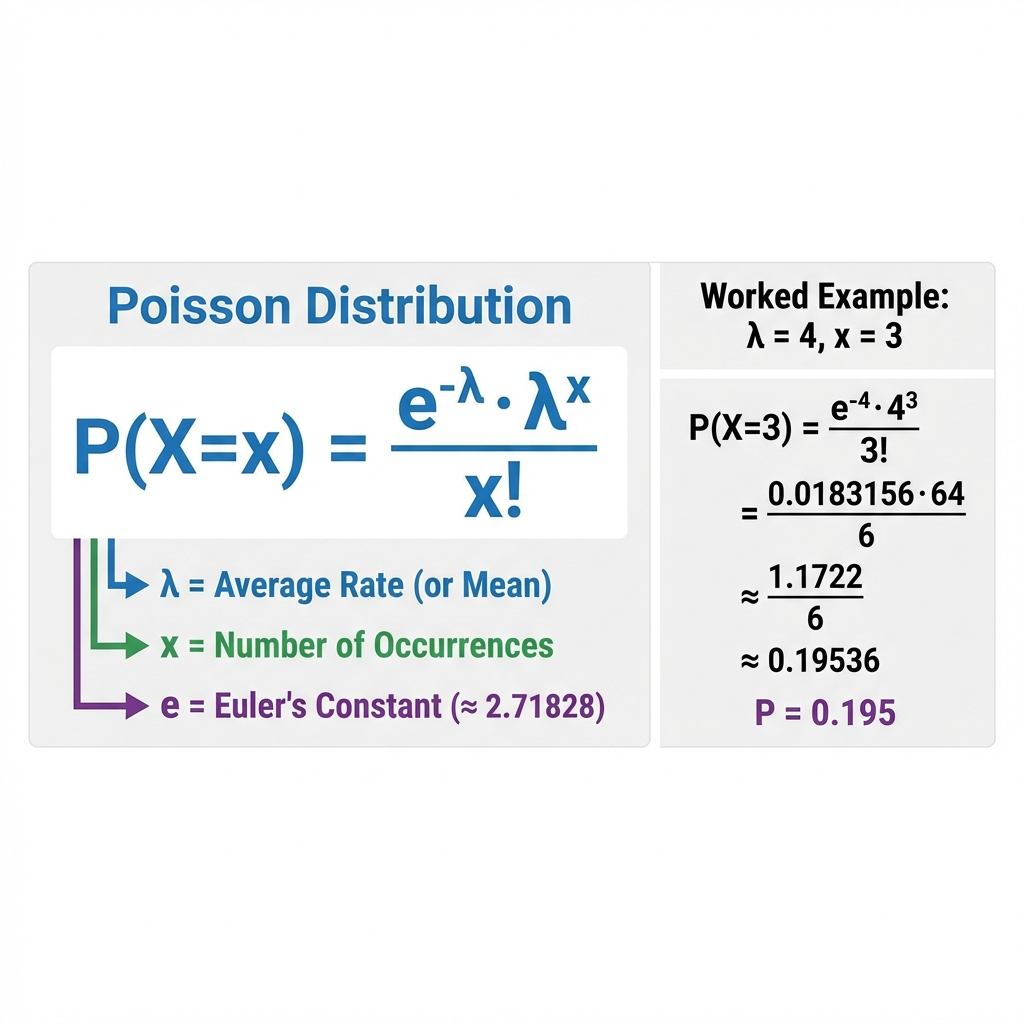
\[ P(X = x) = \frac{e^{-\lambda} \lambda^x}{x!} \]
Where:
- \(P(X = x)\) is the probability of \(x\) occurrences
- \(e\) is Euler's constant (\(\approx 2.71828\))
- \(\lambda\) is the average rate of occurrences
- \(x\) is the number of occurrences (Poisson random variable)
- \(x!\) is the factorial of \(x\)
How To Calculate Poisson Distribution?
- Determine the average rate of occurrences
- Write down the desired number of occurrences (x)
- Calculate the factorial of x
- Put values in the Poisson distribution formula, solve the exponent part
- After that divide the result by the factorial of x
Example:
Suppose you work in a call center where you receive an average of \(\lambda = 4\) calls per minute. Calculate the following probabilities:
- \(P(X = 3)\): Probability of receiving exactly 3 calls in a minute
- \(P(X < 3)\): Probability of receiving less than 3 calls in a minute
- \(P(X \le 3)\): Probability of receiving at most 3 calls in a minute
Solution:
1. Probability \(P(X = 3)\)
Using the Poisson formula:
\[ P(X = 3) = \frac{e^{-\lambda} \lambda^3}{3!} = \frac{e^{-4} \cdot 4^3}{3!} = \frac{0.018315 \cdot 64}{6} \approx 0.19536 \]
So the probability of receiving exactly 3 calls per minute is approximately \(19.54\%\).
2. Probability \(P(X < 3)\)
We sum the probabilities for \(X = 0, 1, 2\):
\[ \begin{aligned} P(X = 0) &= \frac{e^{-4} 4^0}{0!} \approx 0.01832 \\ P(X = 1) &= \frac{e^{-4} 4^1}{1!} \approx 0.07326 \\ P(X = 2) &= \frac{e^{-4} 4^2}{2!} \approx 0.14652 \end{aligned} \]
Adding them:
\[ P(X < 3)=P(0) + P(1) + P(2) \approx 0.01832 + 0.07326 + 0.14652=0.2381 \]
Hence, the probability of receiving less than 3 calls per minute is approximately \(23.81\%\).
3. Probability \(P(X \le 3)\)
We sum the probabilities for \(X = 0, 1, 2, 3\):
\[ P(X \le 3) = P(0) + P(1) + P(2) + P(3) \approx 0.01832 + 0.07326 + 0.14652 + 0.19536 = 0.43346 \]
Thus, the probability of receiving at most 3 calls per minute is approximately \(43.35\%\).
Calculating Poisson probabilities manually can be time-consuming. To save time and simplify the calculation use our poisson distribution calculator. No matter, whether you are a beginner, student, researcher, or professional, the calculator can handle all your Poisson probability needs.
Poisson Distribution Table:
| λ | ||||||||||
|---|---|---|---|---|---|---|---|---|---|---|
| X | 0.1 | 0.2 | 0.3 | 0.4 | 0.5 | 0.6 | 0.7 | 0.8 | 0.9 | 1.0 |
| 0 | 0.9048 | 0.8187 | 0.7408 | 0.6703 | 0.6065 | 0.5488 | 0.4966 | 0.4493 | 0.4066 | 0.3679 |
| 1 | 0.0905 | 0.1637 | 0.2222 | 0.2681 | 0.3033 | 0.3293 | 0.3476 | 0.3595 | 0.3659 | 0.3679 |
| 2 | 0.0045 | 0.0164 | 0.0333 | 0.0536 | 0.0758 | 0.0988 | 0.1217 | 0.1438 | 0.1647 | 0.1839 |
| 3 | 0.0002 | 0.0011 | 0.0033 | 0.0072 | 0.0126 | 0.0198 | 0.0284 | 0.0383 | 0.0494 | 0.0613 |
| 4 | 0.0000 | 0.0001 | 0.0003 | 0.0007 | 0.0016 | 0.0030 | 0.0050 | 0.0077 | 0.0111 | 0.0153 |
| 5 | 0.0000 | 0.0000 | 0.0000 | 0.0001 | 0.0002 | 0.0004 | 0.0007 | 0.0012 | 0.0020 | 0.0031 |
| 6 | 0.0000 | 0.0000 | 0.0000 | 0.0000 | 0.0000 | 0.0000 | 0.0001 | 0.0002 | 0.0003 | 0.0005 |
| 7 | 0.0000 | 0.0000 | 0.0000 | 0.0000 | 0.0000 | 0.0000 | 0.0000 | 0.0000 | 0.0000 | 0.0001 |
What Is The Difference Between Poisson Distribution And Binomial Distribution?
Poisson Distribution:
- The variance is equal to the mean
- The number of event occurrences is counted over a fixed time interval or space
- This is suitable for events happening independently at a constant rate
Binomial Distribution:
- Each trial has Two possible outcomes (success or failure)
- The number of times an experiment is repeated is known
When Do We Use Poisson Distribution?
Poisson distribution is good for modeling independent events at a constant average rate within a specified interval.
Here are some general use cases:
- Counting occurrences
- Rare events
- Quality control
- Queueing systems
Easily calculate Poisson probabilities for these scenarios with the help of our Poisson distribution calculator. It can handle a variety of use cases, providing reliable results.
Reference:
From the source of Wikipedia: Probability mass function, Assumptions and validity.
From the source of Investopedia: Understanding Poisson Distributions.
From the source of Brilliant ORG: Conditions for Poisson Distribution, Probabilities, Properties.
Related Tools