Test Statistic Calculator
Choose the method, enter the values into the test statistic calculator, and click on the “Calculate” button to calculate the statistical value for hypothesis evaluation.
Test Statistic Calculator
This test statistic calculator helps to find the static value for hypothesis testing. The calculated test value shows if there’s enough evidence to reject a null hypothesis. Also, this calculator performs calculations of either for one population mean, comparing two means, single population proportion, and two population proportions.
Our t statistic calculator is highly useful in various fields like research, experimentation, quality control, and data analysis.
What is Test Statistics?
A test statistic is a numerical value obtained from the sample data set. It summarizes the differences between what you observe within your sample and what would be expected if a hypothesis were true.
The t-test statistic also shows how closely your data matches the predicted distribution among the sample tests you perform.
How to Calculate Test Statistics Value?
Understanding how to find test statistics is essential when analyzing data to determine whether to reject a null hypothesis in hypothesis testing. For this process, here are some steps given to find how far the observed data deviates from what is expected under the null hypothesis.
- Collect the data from the populations
- Use the data to find the standard deviation of the population
- Calculate the mean (μ) of the population using this data
- Determine the z-value or sample size
- Use the suitable test statistic formula and get the results
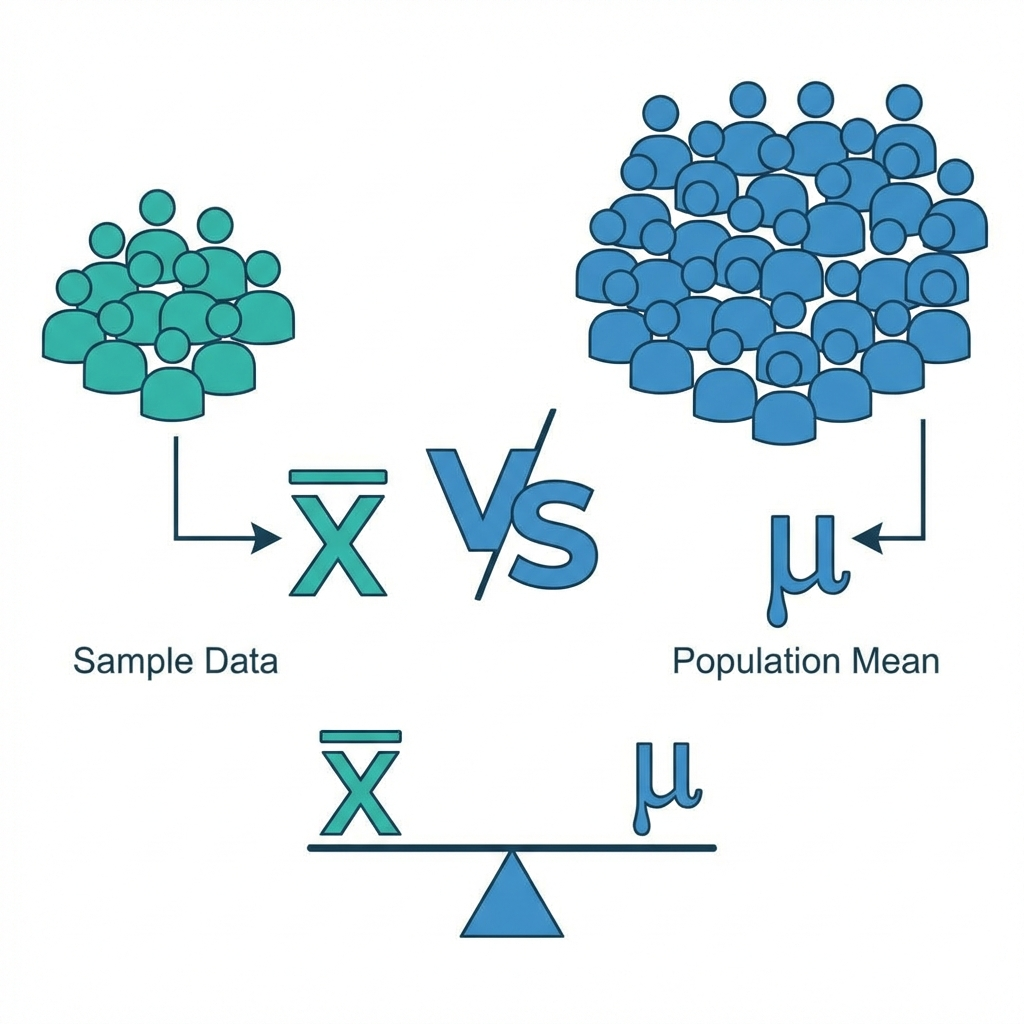
Test Statistic for One Population Mean
Test statistics for a single population mean is calculated when a variable is numeric and involves one population or group.
$$t = \frac{\bar{x} - \mu_0}{\sigma / \sqrt{n}}$$
Where:
- \(\bar{x}\) = Mean of your sample data
- \(\mu_0\) = Hypothesized population mean you are comparing your sample mean to
- \(\sigma\) = Population standard deviation
- \(n\) = Number of observations (sample size) in your dataset
Example:
Suppose we want to test if the average height of adult males in a city is 70 inches. We take a sample of 25 adult males and find the sample mean height to be 71 inches with a sample standard deviation of 3 inches. We use a significance level of 0.05.
Compute the t-statistic:
\[ t = \frac{\bar{x} - \mu_0}{s / \sqrt{n}} = \frac{71 - 70}{3 / \sqrt{25}} \] \[ t = \frac{1}{3 / 5} = \frac{1}{0.6} \approx 1.67 \] ---
Test Statistic for Comparing Two Population Means
This test is applied when numeric values are compared across two populations or groups. To compute the t-statistic, two distinct random samples must be chosen, one from each population.
\[ t = \frac{\bar{x} - \bar{y}}{\sqrt{\frac{\sigma_1^2}{n_1} + \frac{\sigma_2^2}{n_2}}} \]
Where:
- \(\bar{x}\) = mean of sample 1
- \(\bar{y}\) = mean of sample 2
- \(\sigma_1^2\), \(\sigma_2^2\) = population variances of the two samples
- \(n_1\), \(n_2\) = sample sizes of the two populations
Example: Test Statistic Comparing Two Population Means
Suppose we want to test if there is a difference in average test scores between two schools. We take:
- Sample of 30 students from school A: mean = 85, standard deviation = 5
- Sample of 35 students from school B: mean = 82, standard deviation = 6
Compute the t-statistic:
\[ t = \frac{\bar{x}_1 - \bar{x}_2}{\sqrt{\frac{s_1^2}{n_1} + \frac{s_2^2}{n_2}}} \] \[ t = \frac{85 - 82}{\sqrt{\frac{5^2}{30} + \frac{6^2}{35}}} \] \[ t = \frac{3}{\sqrt{\frac{25}{30} + \frac{36}{35}}} \] \[ t = \frac{3}{\sqrt{0.833 + 1.029}} \] \[ t = \frac{3}{\sqrt{1.862}} \approx \frac{3}{1.364} \approx 2.20 \] ---
Test Statistic for a Single Population Proportion
This test determines if a population proportion differs from a specified value \(P_0\). The test statistic is:
\[ z = \frac{\hat{p} - P_0}{\sqrt{\frac{P_0 (1 - P_0)}{n}}} \]
Where:
- \(\hat{p}\) = sample proportion
- \(P_0\) = hypothesized population proportion
Example:
Suppose we want to test if the proportion of left-handed people in a population is 10%. We take a sample of 100 people and find 8 are left-handed (\(\hat{p} = 0.08\)), using a significance level of 0.05.
\[ z = \frac{\hat{p} - P_0}{\sqrt{\frac{P_0 (1-P_0)}{n}}} = \frac{0.08 - 0.10}{\sqrt{\frac{0.10(1-0.10)}{100}}} \] \[ z = \frac{-0.02}{\sqrt{0.009}} = \frac{-0.02}{0.03} \approx -0.67 \] ---
Test Statistic for Two Population Proportions
This test compares proportions between two independent groups:
\[ z = \frac{\hat{p}_1 - \hat{p}_2}{\sqrt{\hat{p}(1-\hat{p})\left(\frac{1}{n_1} + \frac{1}{n_2}\right)}} \]
Where:
- \(\hat{p}_1\), \(\hat{p}_2\) = sample proportions for the two groups
- \(\hat{p} = \frac{x_1 + x_2}{n_1 + n_2}\) = pooled proportion
- \(n_1, n_2\) = sample sizes of the two groups
Example: Test Statistic for Two Population Proportions
Suppose we want to test if the proportion of smokers is different between two cities:
- Sample from City A: 150 people, 30 smokers → \(\hat{p}_1 = \frac{30}{150} = 0.20\)
- Sample from City B: 200 people, 50 smokers → \(\hat{p}_2 = \frac{50}{200} = 0.25\)
- Pooled proportion: \(\hat{p} = \frac{30 + 50}{150 + 200} = \frac{80}{350} \approx 0.229\)
Calculation:
\[ z = \frac{\hat{p}_1 - \hat{p}_2}{\sqrt{\hat{p}(1-\hat{p}) \left(\frac{1}{n_1} + \frac{1}{n_2}\right)}} \] \[ z = \frac{0.20 - 0.25}{\sqrt{0.229 \cdot (1 - 0.229) \cdot \left(\frac{1}{150} + \frac{1}{200}\right)}} \] \[ z = \frac{-0.05}{\sqrt{0.229 \cdot 0.771 \cdot \left(\frac{1}{150} + \frac{1}{200}\right)}} \] \[ z = \frac{-0.05}{\sqrt{0.176 \cdot (0.006667 + 0.005)}} \] \[ z = \frac{-0.05}{\sqrt{0.176 \cdot 0.011667}} \] \[ z = \frac{-0.05}{\sqrt{0.002053}} \] \[ z = \frac{-0.05}{0.0453} \approx -1.11 \]
So, the test statistic is:
\[ z \approx -1.11 \]
Related Tools