Linear Regression Calculator
The linear regression calculator find the linear regression by using the least square method. Get instant calculations for a line of best fit along with graphical interpretation.
What Is Linear Regression?
“Linear regression is a predictive analysis method in which the value of one variable is predicted based on another variable.” Linear regression always indicates a linear relationship between the variables. For quick and accurate calculations, our linear regression calculator is a reliable tool you can use.
Linear Regression Formula:
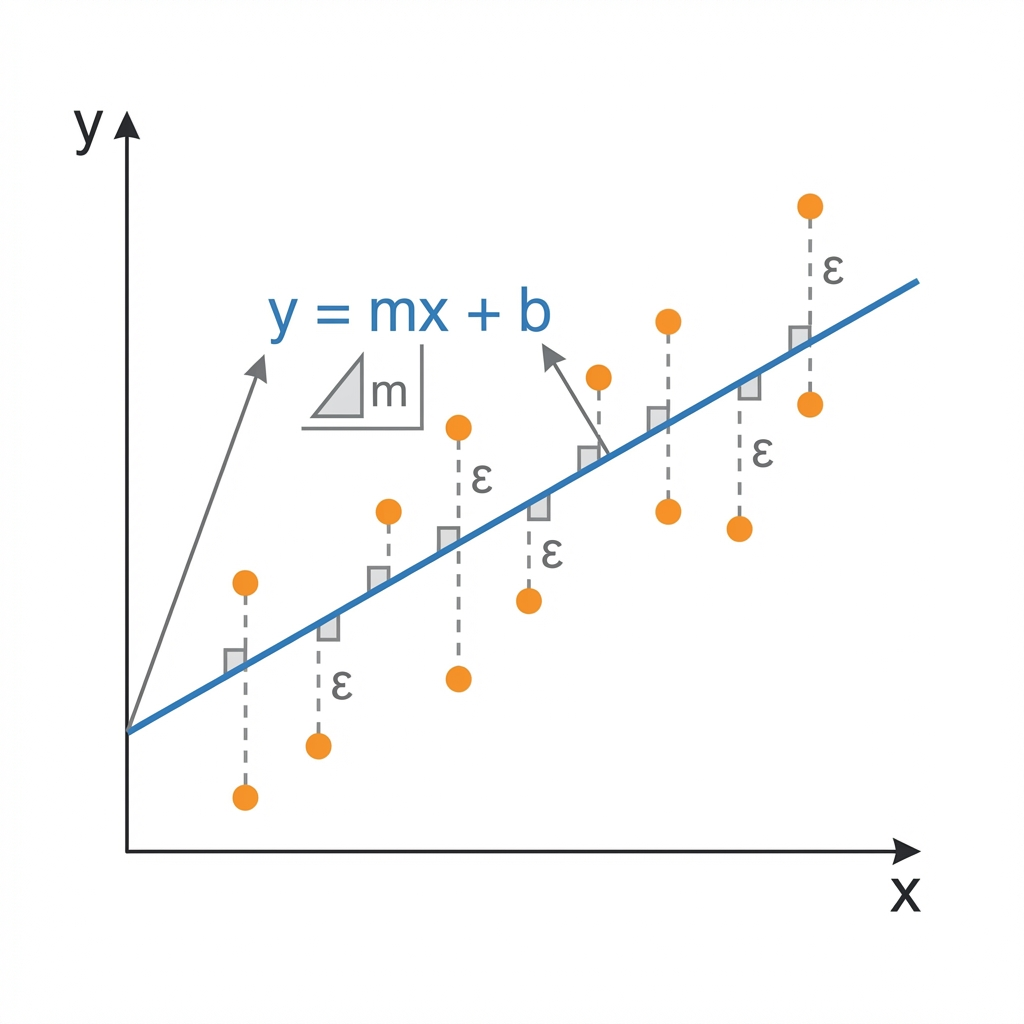
You can evaluate the line that best fits the data points using the following linear regression formula:
ŷ = bX + a
Where:
ŷ = dependent variable (to be predicted)
b = slope of the line
X = independent variable
a = intercept (the value of y when X = 0)
The regression equation calculator uses the same formula to predict results. You can calculate the values of a and b using the following equations:
a = My − (b × Mx)
Where:
Mx = mean of X
My = mean of Y
b = SP / SSx
Where:
SP (Σxy) = Σ(X − Mx) * (Y − My)
SSx (Σx²) = Σ(X − Mx)²
How To Find Line of Best Fit?
Let’s solve a few examples to better understand linear regression analysis and determine the line of best fit for a given dataset:
Example:
Find the least squares regression line for the following dataset:
{(2, 9), (5, 7), (8, 8), (9, 2)}
Also, estimate the value of y for X = 2 and X = 3.
Solution:
Sum of X = 2 + 5 + 8 + 9 = 24
Sum of Y = 9 + 7 + 8 + 2 = 26
Mean values:
Mean of X = Mx = 24 / 4 = 6
Mean of Y = My = 26 / 4 = 6.5
Now, calculate the following quantities:
| X − Mx | Y − My | (X − Mx)² | (X − Mx) * (Y − My) |
|---|---|---|---|
| -4 | 2.5 | 16 | -10 |
| -1 | 0.5 | 1 | -0.5 |
| 2 | 1.5 | 4 | 3 |
| 3 | -4.5 | 9 | -13.5 |
SSx (Σ(X − Mx)²) = 16 + 1 + 4 + 9 = 30
SP (Σ(X − Mx)*(Y − My)) = -10 - 0.5 + 3 - 13.5 = -21
Now, determine the linear regression equation:
ŷ = bX + a
Calculate the values of a and b:
b = SP / SSx = -21 / 30 = -0.7
a = My − (b × Mx) = 6.5 − (-0.7 × 6) = 6.5 + 4.2 = 10.7
Now, plug the values into the regression formula:
ŷ = -0.7X + 10.7
For given values of X, the estimated values of Y are as follows:
| Estimate | Estimated Y |
|---|---|
| 2 | 9.3 |
| 3 | 8.6 |
The graphical plot of line of best fit is as follows:
Related Tools