Coefficient of Determination Calculator (R-squared)
Enter your data set values and the calculator will instantly calculate their variance (sample or population), coefficient of variation, and the sum of squares, with detailed calculations shown.
An online coefficient of determination calculator allows you to determine the correlation coefficient, R-squared (coefficient of determination) value of the given variable dataset. This r value calculator displays the relationship among the given two datasets and predicts the preciseness of future outcomes. In the text, you can understand better what is R squared in statistics, and how to find coefficient of determination with the R squared formula.
What is the Coefficient of Determination?
In statistics, the coefficient of determination is also called the R-squared value, which is the result of the regression analysis method. The coefficient of determination measures how closely the actual data points match the regression prediction, thereby quantifying the strength of the linear relationship between the explanatory variable and the explained variable. So, it is sometimes called model fitting. In most cases, the coefficient of determination is called R2 that referred to as "R-squared" for short. However, an online Coefficient of Variation Calculator helps to evaluate the coefficient of variation corresponding to the given dataset values.
Coefficient of Determination Formula:
There are multiple Formulas used by the R value calculator to compute the coefficient of determination:
Using Correlation Coefficient:
\[ r = \frac{\sum (A - A_m)(B - B_m)} {\sqrt{\sum (A - A_m)^2 \; \sum (B - B_m)^2}} \]
Where,
\(A\) represents the data points in data set A
\(B\) represents the data points in data set B
\(A_m\) represents the mean of data set A
\(B_m\) represents the mean of data set B
Then,
Coefficient of Determination = (Correlation Coefficient)^2
Using Regression outputs:
The following formula is used by the coefficient of determination calculator for regression outputs:
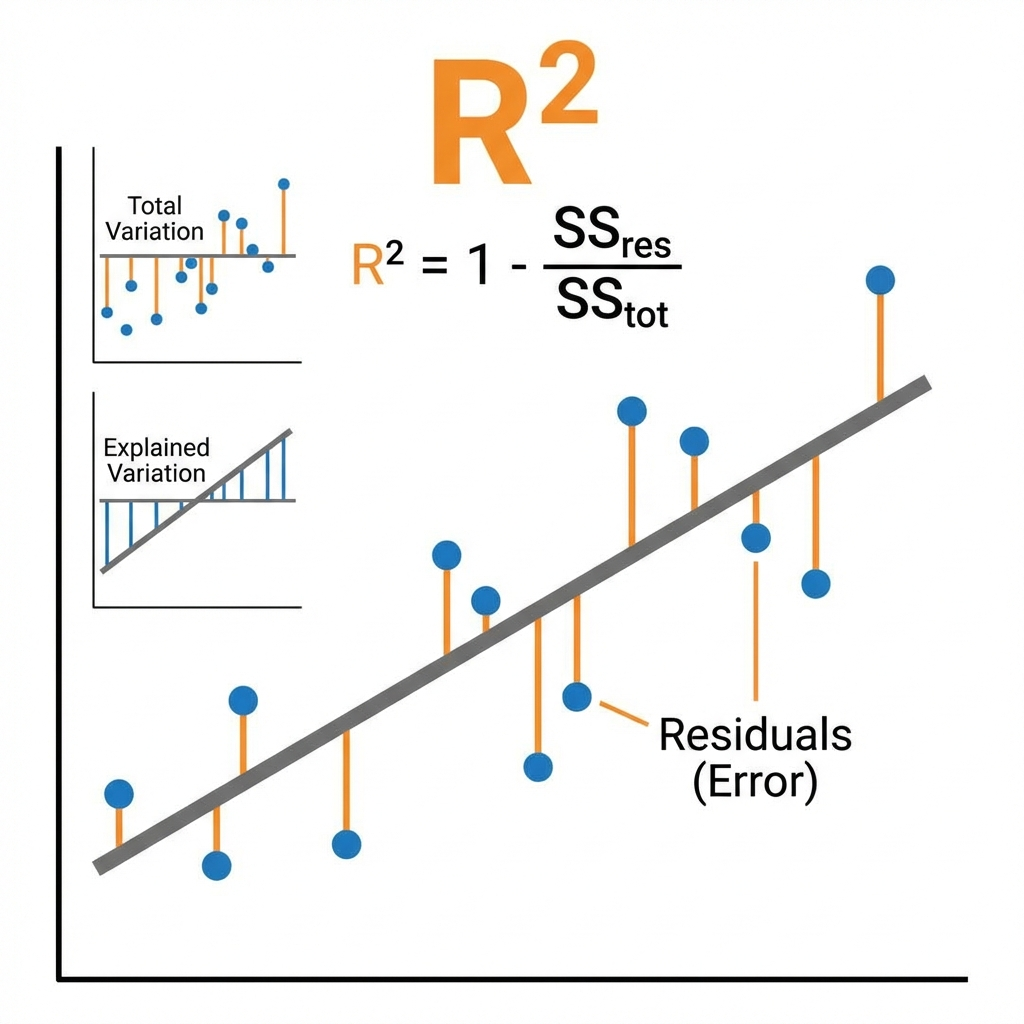
\[ R^2 \; (\text{Coefficient of Determination}) = \frac{\text{Explained Variation}}{\text{Total Variation}} \]
\[ R^2 = \frac{\text{MSS}}{\text{TSS}} \]
\[ R^2 = \frac{\text{TSS} - \text{RSS}}{\text{TSS}} \]
Where:
\[ \text{Total Sum of Squares (TSS)} = \sum (Y_i - Y_m)^2 \]
\[ \text{Model Sum of Squares (MSS)} = \sum (\hat{Y} - Y_m)^2 \]
\[ \text{Residual Sum of Squares (RSS)} = \sum (Y_i - \hat{Y})^2 \]
Y^ is the predicted value, Ym is the mean value, and Y_i is the ith value of the model.
However, the Covariance Calculator estimates the covariance between two random variables X and Y in statistics experiments.
How to Calculate Coefficient of Determination?
Find the coefficient of determination of: (12, 13, 23, 44, 55), (17, 10, 20, 14, 35).
When you substitute these datasets in the r squared calculator, it calculates the coefficient of determination as:
When you substitute the same values in the r2 calculator, it shows similar table for the given regression model.
| Obs. | X | Y | Xᵢ² | Yᵢ² | Xᵢ⋅Yᵢ |
| 1 | 12 | 17 | 144 | 289 | 204 |
| 2 | 13 | 10 | 169 | 100 | 130 |
| 3 | 23 | 20 | 529 | 400 | 460 |
| 4 | 44 | 14 | 1936 | 196 | 616 |
| 5 | 55 | 35 | 3025 | 1225 | 1925 |
| Sum = | 147 | 96 | 5803 | 2210 | 3335 |
Number of values (n) = 5
Now, coefficient of determination calculator finds:
\[ SS_{xx} = \sum_{i=1}^{n} X_i^2 - \frac{1}{n}\left(\sum_{i=1}^{n} X_i\right)^2 \]
\[ SS_{xx} = 5803 - \frac{1}{5} \times 21609 \]
\[ SS_{xx} = 1481.2 \]
In the next step, find:
\[ SS_{yy} = \sum_{i=1}^{n} Y_i^2 - \frac{1}{n}\left(\sum_{i=1}^{n} Y_i\right)^2 \]
\[ SS_{yy} = 2210 - \frac{1}{5} \times 9216 \]
\[ SS_{yy} = 366.8 \]
Now, find:
\[ SS_{xy} = \sum_{i=1}^{n} X_i Y_i - \frac{1}{n} \left(\sum_{i=1}^{n} X_i\right) \left(\sum_{i=1}^{n} Y_i\right) \]
\[ SS_{xy} = 3335 - \frac{1}{5} \times 14112 \]
\[ SS_{xy} = 512.6 \]
Then, the R-squared calculator finds the correlation coefficient:
\[ R = \frac{SS_{xy}}{\sqrt{SS_{xx} \times SS_{yy}}} = \frac{512.6}{\sqrt{1481.2 \times 366.8}} \]
\[ R = 0.6954 \]
Hence, the coefficient of determination is:
\[ R^2 = (0.6954)^2 \]
\[ R^2 = 0.4836 \]
Correlation and R-squared:
In the simple linear least-squares regression, \[ Y = aX + b \] the square of the Pearson correlation coefficient coincides with the coefficient of determination \[ R^2 \] between the data points \[ x_1, x_2, \ldots, x_n \] and \[ y_1, y_2, \ldots, y_n. \]
Interpret the Coefficient of Determination:
The coefficient of determination is a number between 0 and 1 that can be converted to a percentage by multiplying it by 100. The standard interpretation is the amount of change in y, which can be explained by the x. In other words, the data also corresponds to the regression model you are using and describes it. However, it is crucial to note the general caveats of the relevant data. These two variables can be related to each other without any causal relationship.
How Coefficient of Determination Calculator Works?
The r value calculator provides the variability of a factor in relation to another factor by following these steps:
Input:
First of all, substitute datasets in both fields that are separated with commas. Hit the calculate button for the solution.
Output:
- The R^2 calculator provides Coefficient of Determination (R^2), Correlation Coefficient, and interpretation.
- This calculator also performs step-by-step calculations according to the three different methods with different formulas for the given values.
FAQ:
What is a good coefficient of determination?
An extremely reliable model for future predictions and a value of 1.0 indicates a perfect fit, while a value of 0.0 indicates that the computation fails to accurately model the data.
What are the multiple coefficients of determination?
The multiple coefficients of determination (R2) measure the amount of change in the dependent variable, which can be predicted based on the explanatory variable set in the multiple regression equation.
What does R explain?
In statistics, the correlation coefficient r measures the direction and strength of the linear relationship between two different variables on the scatter plot. The r value is always in the range of +1 to -1.
What is the non-determination coefficient?
The Non-Determination Coefficient explains the amount of unaccounted, or unexplained, the variance between the two variables, or a set of variables (predictors) in the outcome variable. Where the Non-Determination Coefficient is simply 1 – R2.
The Final Line:
The coefficient of determination calculator finds the correlation coefficient, r squared for the given regression model. Also, provide interpretation in the form of variance percentage in datasets. This calculator provides the solution in different ways such as the regression sum method and correlation coefficient method.
Reference:
From the source of Wikipedia: Coefficient of determination, Relation to unexplained variance, explained variance, squared correlation coefficient, Interpretation. From the source of Investopedia: Understanding the Coefficient of Determination, Graphing the Coefficient of Determination, multivariate linear model. From the source of Stat Trek: Coefficient of Determination, linear regression, standard deviation.
Related Tools