Prediction Interval Calculator
Enter the dependent and independent variable in the calculator and the tool will find the prediction interval of range.
What is the Prediction Interval Statistic?
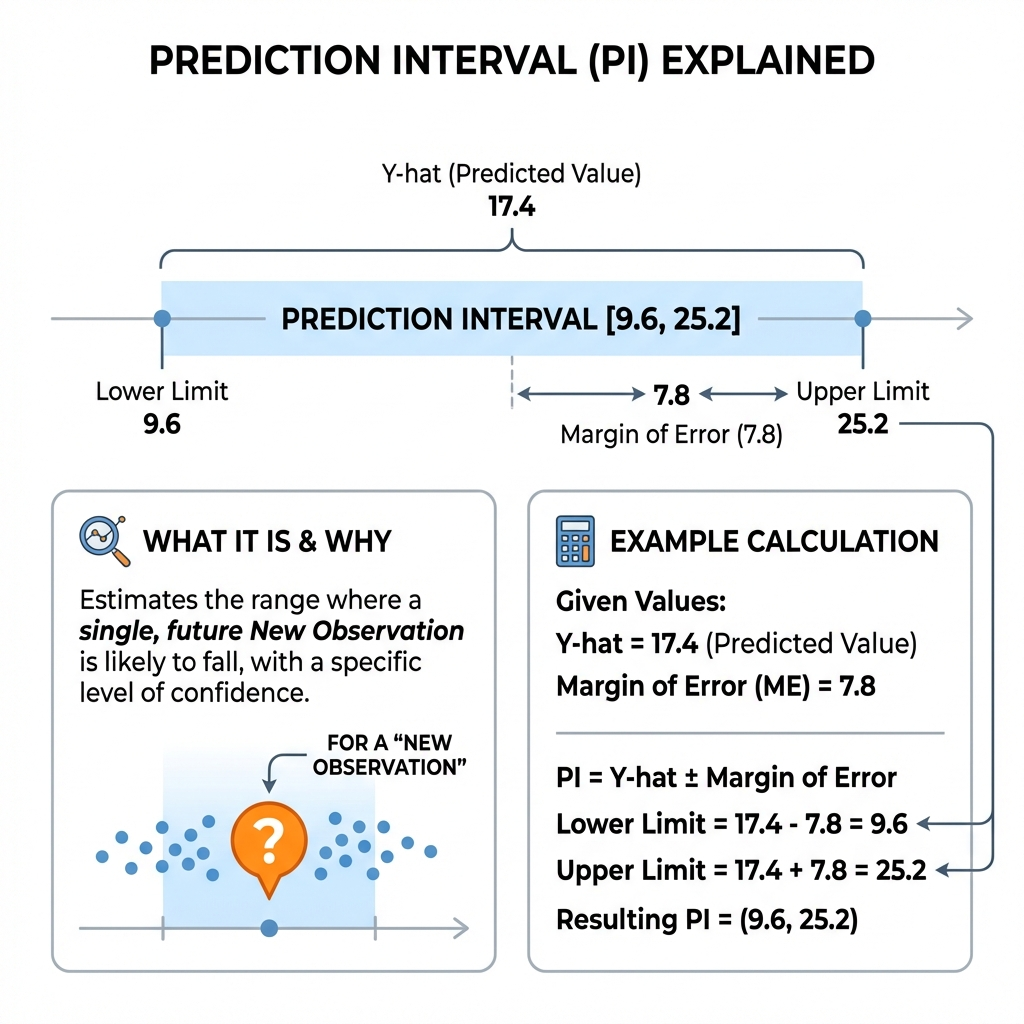
A prediction interval defines a certain range of values around which the response is going to fall or is expected to fall. For example, for 95 % of the prediction interval or range [5,10], you are 95 % certain that the next value is going to fall in this range. The indicated prediction interval calculator online makes it clear what is the confidence level of a certain range or a prediction in regression analysis. The confidence interval of the linear regression values of the response variable can be checked by the prediction interval.
How to Calculate the Prediction Interval?
Consider the data sample of the independent variables 6, 7, 7, 8, 12, 14, 15, 16, 16, 19, and the dependent variable 14, 15, 15, 17, 18, 18, 16, 14, 11, and 8. The confidence level is 95% and the Xo is “3”.
Solution:
So, the predicted value of the The given data that is available for dependent and independent variables:
| Obs. | X | Y |
| 1 | 6 | 14 |
| 2 | 7 | 15 |
| 3 | 7 | 15 |
| 4 | 8 | 17 |
| 5 | 12 | 18 |
| 6 | 14 | 18 |
| 7 | 15 | 16 |
| 8 | 16 | 14 |
| 9 | 16 | 11 |
| 10 | 19 | 8 |
Now by the predicted and the response variable, we construct the following table
| Obs. | X | Y | Xᵢ² | Yᵢ² | Xᵢ · Yᵢ |
| 1 | 6 | 14 | 36 | 196 | 84 |
| 2 | 7 | 15 | 49 | 225 | 105 |
| 3 | 7 | 15 | 49 | 225 | 105 |
| 4 | 8 | 17 | 64 | 289 | 136 |
| 5 | 12 | 18 | 144 | 324 | 216 |
| 6 | 14 | 18 | 196 | 324 | 252 |
| 7 | 15 | 16 | 225 | 256 | 240 |
| 8 | 16 | 14 | 256 | 196 | 224 |
| 9 | 16 | 11 | 256 | 121 | 176 |
| 10 | 19 | 8 | 361 | 64 | 152 |
| Sum = | 120 | 146 | 1636 | 2220 | 1690 |
The predicted value calculator draws tables of the dependent and independent variables and evaluates the best-fitting prediction interval.
\[ SS_{XX} = \sum_{i=1}^{n} X_i^2 - \frac{1}{n} \left( \sum_{i=1}^{n} X_i \right)^2 \]
\[ SS_{XX} = 1636 - \frac{1}{10} (120)^2 = 196 \]
\[ SS_{YY} = \sum_{i=1}^{n} Y_i^2 - \frac{1}{n} \left( \sum_{i=1}^{n} Y_i \right)^2 \]
\[ SS_{YY} = 2220 - \frac{1}{10} (146)^2 = 88.4 \]
\[ SS_{XY} = \sum_{i=1}^{n} X_i Y_i - \frac{1}{n} \left( \sum_{i=1}^{n} X_i \right) \left( \sum_{i=1}^{n} Y_i \right) \]
\[ SS_{XY} = 1690 - \frac{1}{10} (120)(146) = -62 \]
The slope and y-intercept are calculated as:
\[ \hat{\beta}_1 = \frac{SS_{XY}}{SS_{XX}} = \frac{-62}{196} = -0.31633 \]
\[ \hat{\beta}_0 = \bar{Y} - \hat{\beta}_1 \bar{X} = 14.6 - (-0.31633 \times 12) = 18.396 \]
The regression equation is:
\[ \hat{Y} = 18.396 - 0.31633 X \]
Sum of squares calculations:
\[ SS_{Total} = SS_{YY} = 88.4 \]
\[ SS_{R} = \hat{\beta}_1 SS_{XY} = -0.31633 \times -62 = 19.612 \]
\[ SS_{E} = SS_{Total} - SS_{R} = 88.4 - 19.612 = 68.788 \]
Mean squared error (MSE):
\[ MSE = \frac{SS_{E}}{n-2} = \frac{68.788}{10-2} = 8.5987 \]
Standard error:
\[ \hat{\sigma} = \sqrt{MSE} = \sqrt{8.5987} = 2.9324 \]
As, we figure a 95% prediction interval for the predicted value is 17.4467, and the level that is used equals 0.05 as verified by 95 prediction interval calculator. The critical t-value for df = n − 2 = 10 - 2 = 8 degrees of freedom, and α = 0.05 is t = 2.16. Now, the data is organized to determine the margin error for the prediction interval with this all given information.
The predicted value formula for a 95% prediction interval is:
\[ E = t_{\sigma/2; n-2} \times \sqrt{ \sigma^2 \left( 1 + \frac{1}{n} + \frac{(X_0 - \bar{X})^2}{SS_{XX}} \right) } \]
Substitute the values:
\[ E = 2.16 \times \sqrt{ 8.5987 \left( 1 + \frac{1}{10} + \frac{(3 - 12)^2}{196} \right) } = 7.7916 \]
So, the predicted value of Y is:
\[ \hat{Y} = 17.4467 \]
The 95% Prediction Interval (PI) is:
\[ PI = (\hat{Y} - E, \hat{Y} + E) \]
\[ PI = (17.4467 - 7.7916, 17.4467 + 7.7916) \]
\[ PI = (9.6551, 25.2383) \]
This means the best predicted value falls within the 95% prediction interval from 9.6551 to 25.2383. Using a linear regression calculator, you can verify this step-by-step.
Working of Prediction Interval Calculator:
Our prediction calculator is quite straightforward to use! It requires a couple of data set values to compute the prediction interval. Let’s see how!
Input:
- Enter the independent(X) and dependent variable(Y)
- Enter the confidence level and Xo values for prediction
- Tap Calculate
Ouput:
- Step-by-step calculation of Prediction Interval
- Range of Prediction Interval
References:
From the source of the statisticsbyjim.com: Prediction intervals From the source of study.com: Confidence Interval, What is a Prediction Interval?
Related Tools